Many processes blocked at ProcArrayLock
| Lists: | pgsql-hackers |
|---|
| From: | Xiaoyulei <xiaoyulei(at)huawei(dot)com> |
|---|---|
| To: | "pgsql-hackers(at)postgresql(dot)org" <pgsql-hackers(at)postgresql(dot)org> |
| Subject: | Many processes blocked at ProcArrayLock |
| Date: | 2014-12-02 08:07:55 |
| Message-ID: | E8870A2F6A4B1045B1C292B77EAB207C77069A80@SZXEMA501-MBX.china.huawei.com |
| Views: | Raw Message | Whole Thread | Download mbox | Resend email |
| Lists: | pgsql-hackers |
Test configuration:
Hardware:
4P intel server, 60 core 120 hard thread.
Memory:512G
SSD:2.4T
PG:
max_connections = 160 # (change requires restart)
shared_buffers = 32GB
work_mem = 128MB
maintenance_work_mem = 32MB
bgwriter_delay = 100ms # 10-10000ms between rounds
bgwriter_lru_maxpages = 200 # 0-1000 max buffers written/round
bgwriter_lru_multiplier = 2.0 # 0-10.0 multipler on buffers scanned/round
wal_level = minimal # minimal, archive, or hot_standby
wal_buffers = 256MB # min 32kB, -1 sets based on shared_buffers
autovacuum = off
checkpoint_timeout=60min
checkpoint_segments = 1000
archive_mode = off
synchronous_commit = off
fsync = off
full_page_writes = off
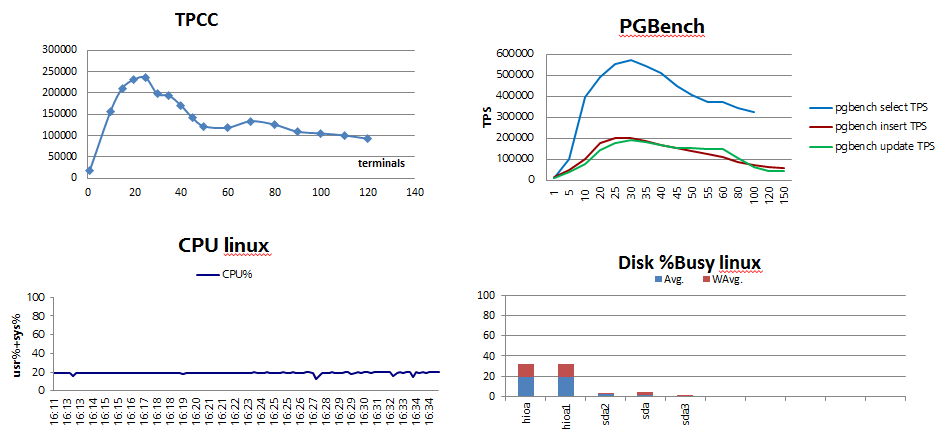
We use tpcc and pgbench to test postgresql 9.4beat2 performance. And we found the tps/tpmc could not increase with the terminal increase. The detail information is in attachment.
Many processes is blocked, I dump the call stack, and found these processes is blocked at: ProcArrayLock. 60% processes is blocked in ProcArrayEndTransaction with ProcArrayLock EXCLUSIVE, 20% is in GetSnapshotData with ProcArrayLock SHARED. Others locks like XLogFlush and WALInsertLock are not very heavy.
Is there any way we solve this problem?
| Attachment | Content-Type | Size |
|---|---|---|
|
image/png | 21.6 KB |
| From: | Michael Paquier <michael(dot)paquier(at)gmail(dot)com> |
|---|---|
| To: | Xiaoyulei <xiaoyulei(at)huawei(dot)com> |
| Cc: | "pgsql-hackers(at)postgresql(dot)org" <pgsql-hackers(at)postgresql(dot)org> |
| Subject: | Re: Many processes blocked at ProcArrayLock |
| Date: | 2014-12-03 00:48:22 |
| Message-ID: | CAB7nPqQa6OBPCDxgVLEcg_xXneCytChn3EZRM4eOmYdcJ-R=ow@mail.gmail.com |
| Views: | Raw Message | Whole Thread | Download mbox | Resend email |
| Lists: | pgsql-hackers |
On Tue, Dec 2, 2014 at 5:07 PM, Xiaoyulei <xiaoyulei(at)huawei(dot)com> wrote:
> Test configuration:
> Hardware:
> 4P intel server, 60 core 120 hard thread.
> Memory:512G
> SSD:2.4T
>
> PG:
> max_connections = 160 # (change requires restart)
> shared_buffers = 32GB
> work_mem = 128MB
> maintenance_work_mem = 32MB
> bgwriter_delay = 100ms # 10-10000ms between rounds
> bgwriter_lru_maxpages = 200 # 0-1000 max buffers written/round
> bgwriter_lru_multiplier = 2.0 # 0-10.0 multipler on buffers scanned/round
> wal_level = minimal # minimal, archive, or hot_standby
> wal_buffers = 256MB # min 32kB, -1 sets based on shared_buffers
> autovacuum = off
> checkpoint_timeout=60min
> checkpoint_segments = 1000
> archive_mode = off
> synchronous_commit = off
> fsync = off
> full_page_writes = off
>
>
> We use tpcc and pgbench to test postgresql 9.4beat2 performance. And we found the tps/tpmc could not increase with the terminal increase. The detail information is in attachment.
>
> Many processes is blocked, I dump the call stack, and found these processes is blocked at: ProcArrayLock. 60% processes is blocked in ProcArrayEndTransaction with ProcArrayLock EXCLUSIVE, 20% is in GetSnapshotData with ProcArrayLock SHARED. Others locks like XLogFlush and WALInsertLock are not very heavy.
>
> Is there any way we solve this problem?
Providing complete backtraces showing in which code paths those
processes are blocked would help better in understand what may be
going on.
--
Michael
| From: | Xiaoyulei <xiaoyulei(at)huawei(dot)com> |
|---|---|
| To: | Michael Paquier <michael(dot)paquier(at)gmail(dot)com> |
| Cc: | "pgsql-hackers(at)postgresql(dot)org" <pgsql-hackers(at)postgresql(dot)org> |
| Subject: | Re: Many processes blocked at ProcArrayLock |
| Date: | 2014-12-03 03:34:13 |
| Message-ID: | E8870A2F6A4B1045B1C292B77EAB207C7706ADA8@SZXEMA501-MBX.china.huawei.com |
| Views: | Raw Message | Whole Thread | Download mbox | Resend email |
| Lists: | pgsql-hackers |
I put all the stack in attachment.
> -----Original Message-----
> From: Michael Paquier [mailto:michael(dot)paquier(at)gmail(dot)com]
> Sent: Wednesday, December 03, 2014 8:48 AM
> To: Xiaoyulei
> Cc: pgsql-hackers(at)postgresql(dot)org
> Subject: Re: [HACKERS] Many processes blocked at ProcArrayLock
>
> On Tue, Dec 2, 2014 at 5:07 PM, Xiaoyulei <xiaoyulei(at)huawei(dot)com> wrote:
> > Test configuration:
> > Hardware:
> > 4P intel server, 60 core 120 hard thread.
> > Memory:512G
> > SSD:2.4T
> >
> > PG:
> > max_connections = 160 # (change requires restart)
> > shared_buffers = 32GB
> > work_mem = 128MB
> > maintenance_work_mem = 32MB
> > bgwriter_delay = 100ms # 10-10000ms between rounds
> > bgwriter_lru_maxpages = 200 # 0-1000 max buffers
> written/round
> > bgwriter_lru_multiplier = 2.0 # 0-10.0 multipler on buffers
> scanned/round
> > wal_level = minimal # minimal, archive, or
> hot_standby
> > wal_buffers = 256MB # min 32kB, -1 sets based on
> shared_buffers
> > autovacuum = off
> > checkpoint_timeout=60min
> > checkpoint_segments = 1000
> > archive_mode = off
> > synchronous_commit = off
> > fsync = off
> > full_page_writes = off
> >
> >
> > We use tpcc and pgbench to test postgresql 9.4beat2 performance. And we
> found the tps/tpmc could not increase with the terminal increase. The detail
> information is in attachment.
> >
> > Many processes is blocked, I dump the call stack, and found these processes
> is blocked at: ProcArrayLock. 60% processes is blocked in
> ProcArrayEndTransaction with ProcArrayLock EXCLUSIVE, 20% is in
> GetSnapshotData with ProcArrayLock SHARED. Others locks like XLogFlush and
> WALInsertLock are not very heavy.
> >
> > Is there any way we solve this problem?
> Providing complete backtraces showing in which code paths those processes
> are blocked would help better in understand what may be going on.
> --
> Michael
| Attachment | Content-Type | Size |
|---|---|---|
| ret_201411131712.txt | text/plain | 113.1 KB |
| From: | Alvaro Herrera <alvherre(at)2ndquadrant(dot)com> |
|---|---|
| To: | Xiaoyulei <xiaoyulei(at)huawei(dot)com> |
| Cc: | Michael Paquier <michael(dot)paquier(at)gmail(dot)com>, "pgsql-hackers(at)postgresql(dot)org" <pgsql-hackers(at)postgresql(dot)org> |
| Subject: | Re: Many processes blocked at ProcArrayLock |
| Date: | 2014-12-03 13:05:42 |
| Message-ID: | 20141203130542.GX1737@alvh.no-ip.org |
| Views: | Raw Message | Whole Thread | Download mbox | Resend email |
| Lists: | pgsql-hackers |
Xiaoyulei wrote:
> I put all the stack in attachment.
Not sure that this is really all that useful. At least I don't have the
patience to examine all this, and I'm not sure it contains the needed
info in the first place. If you were to ensure your build is using
-fno-omit-frame-pointer in cflags and then used "perf record -a -g"
while the test runs and "perf report -g" once it's finished, you'd get a
useful profile that would show who is acquiring the problematic lock and
why.
--
Álvaro Herrera http://www.2ndQuadrant.com/
PostgreSQL Development, 24x7 Support, Training & Services