wal_buffers, redux
| Lists: | pgsql-hackers |
|---|
| From: | Robert Haas <robertmhaas(at)gmail(dot)com> |
|---|---|
| To: | pgsql-hackers(at)postgresql(dot)org |
| Subject: | wal_buffers, redux |
| Date: | 2012-03-11 03:55:13 |
| Message-ID: | CA+TgmobgMv_aaakLoasBt=5iYfi=kdcOUz0X9TdYe0c2SZ=2Pg@mail.gmail.com |
| Views: | Raw Message | Whole Thread | Download mbox | Resend email |
| Lists: | pgsql-hackers |
I've finally been able to run some more tests of the effect of
adjusting wal_buffers to values higher than 16MB. I ran the test on
the 16 core (x 4 hw threads/core) IBM POWER7 machine, with my usual
configuration settings:
shared_buffers = 8GB
maintenance_work_mem = 1GB
synchronous_commit = off
checkpoint_segments = 300
checkpoint_timeout = 15min
checkpoint_completion_target = 0.9
wal_writer_delay = 20ms
I ran three 30-minute tests at scale factor 300 with wal_buffers set
at various values from 16MB up to 160MB, in multiples of 16MB, using
pgbench with 32 clients and 32 threads in each case. The short
version is that 32MB seems to be significantly better than 16MB, by
about 1000 tps, and after that it gets murky; full results are below.
16MB tps = 13069.420658 (including connections establishing)
16MB tps = 14370.293228 (including connections establishing)
16MB tps = 13787.219680 (including connections establishing)
32MB tps = 14916.068968 (including connections establishing)
32MB tps = 14746.448728 (including connections establishing)
32MB tps = 15110.676467 (including connections establishing)
48MB tps = 15111.981870 (including connections establishing)
48MB tps = 12824.628192 (including connections establishing)
48MB tps = 15090.280081 (including connections establishing)
64MB tps = 15382.740815 (including connections establishing)
64MB tps = 12367.942312 (including connections establishing)
64MB tps = 15195.405382 (including connections establishing)
80MB tps = 15346.080326 (including connections establishing)
80MB tps = 12791.192216 (including connections establishing)
80MB tps = 14780.804054 (including connections establishing)
96MB tps = 15476.229392 (including connections establishing)
96MB tps = 15426.012162 (including connections establishing)
96MB tps = 15548.671849 (including connections establishing)
112MB tps = 15400.669675 (including connections establishing)
112MB tps = 15676.416378 (including connections establishing)
112MB tps = 15016.651083 (including connections establishing)
128MB tps = 15811.463522 (including connections establishing)
128MB tps = 15590.343669 (including connections establishing)
128MB tps = 15256.867665 (including connections establishing)
144MB tps = 15842.131696 (including connections establishing)
144MB tps = 15669.880640 (including connections establishing)
144MB tps = 15753.460908 (including connections establishing)
160MB tps = 15658.726637 (including connections establishing)
160MB tps = 15599.600752 (including connections establishing)
160MB tps = 15311.198480 (including connections establishing)
--
Robert Haas
EnterpriseDB: http://www.enterprisedb.com
The Enterprise PostgreSQL Company
| From: | Fujii Masao <masao(dot)fujii(at)gmail(dot)com> |
|---|---|
| To: | Robert Haas <robertmhaas(at)gmail(dot)com> |
| Cc: | pgsql-hackers(at)postgresql(dot)org |
| Subject: | Re: wal_buffers, redux |
| Date: | 2012-03-12 03:51:15 |
| Message-ID: | CAHGQGwGxPiiQFjAddHoU4XYx7VEKzXmzBAv0mS7aq4J4EdZ00w@mail.gmail.com |
| Views: | Raw Message | Whole Thread | Download mbox | Resend email |
| Lists: | pgsql-hackers |
On Sun, Mar 11, 2012 at 12:55 PM, Robert Haas <robertmhaas(at)gmail(dot)com> wrote:
> I've finally been able to run some more tests of the effect of
> adjusting wal_buffers to values higher than 16MB. I ran the test on
> the 16 core (x 4 hw threads/core) IBM POWER7 machine, with my usual
> configuration settings:
>
> shared_buffers = 8GB
> maintenance_work_mem = 1GB
> synchronous_commit = off
> checkpoint_segments = 300
> checkpoint_timeout = 15min
> checkpoint_completion_target = 0.9
> wal_writer_delay = 20ms
>
> I ran three 30-minute tests at scale factor 300 with wal_buffers set
> at various values from 16MB up to 160MB, in multiples of 16MB, using
> pgbench with 32 clients and 32 threads in each case. The short
> version is that 32MB seems to be significantly better than 16MB, by
> about 1000 tps, and after that it gets murky; full results are below.
Currently the max of wal_buffers is 16MB (i.e., the size of one WAL file)
when it's set to -1. Thanks to your result, we should increase the max to
32MB?
Regards,
--
Fujii Masao
NIPPON TELEGRAPH AND TELEPHONE CORPORATION
NTT Open Source Software Center
| From: | Robert Haas <robertmhaas(at)gmail(dot)com> |
|---|---|
| To: | Fujii Masao <masao(dot)fujii(at)gmail(dot)com> |
| Cc: | pgsql-hackers(at)postgresql(dot)org |
| Subject: | Re: wal_buffers, redux |
| Date: | 2012-03-12 14:16:23 |
| Message-ID: | CA+TgmoaXvKogH-hTQtNCRsyrC_7zJStesXDzhxZOtjJn4+UjAw@mail.gmail.com |
| Views: | Raw Message | Whole Thread | Download mbox | Resend email |
| Lists: | pgsql-hackers |
On Sun, Mar 11, 2012 at 11:51 PM, Fujii Masao <masao(dot)fujii(at)gmail(dot)com> wrote:
> On Sun, Mar 11, 2012 at 12:55 PM, Robert Haas <robertmhaas(at)gmail(dot)com> wrote:
>> I've finally been able to run some more tests of the effect of
>> adjusting wal_buffers to values higher than 16MB. I ran the test on
>> the 16 core (x 4 hw threads/core) IBM POWER7 machine, with my usual
>> configuration settings:
>>
>> shared_buffers = 8GB
>> maintenance_work_mem = 1GB
>> synchronous_commit = off
>> checkpoint_segments = 300
>> checkpoint_timeout = 15min
>> checkpoint_completion_target = 0.9
>> wal_writer_delay = 20ms
>>
>> I ran three 30-minute tests at scale factor 300 with wal_buffers set
>> at various values from 16MB up to 160MB, in multiples of 16MB, using
>> pgbench with 32 clients and 32 threads in each case. The short
>> version is that 32MB seems to be significantly better than 16MB, by
>> about 1000 tps, and after that it gets murky; full results are below.
>
> Currently the max of wal_buffers is 16MB (i.e., the size of one WAL file)
> when it's set to -1. Thanks to your result, we should increase the max to
> 32MB?
I think that might be a good idea, although I'm not entirely convinced
that we understand why increasing wal_buffers is helping as much as it
is. I stuck an elog() into AdvanceXLInsertBuffer() to complain in the
case that we were writing buffers while holding the insert lock.
Then, I reran 30-minute tests 32 clients, one with wal_buffers=16MB
and the other wal_buffers=32MB. On the 16MB test, the elog() fired 15
times in a single second shortly after the start of the test, and then
9 more times over the rest of the test. On the 32MB test, the elog()
fired a total 6 times over the course of the test. The first test got
14320 tps, while the second got 15026 tps. I find that quite
surprising, because although WAL buffer wraparound is certainly bad
(on this test, it probably brings the system completely to a halt
until fsync() finishes) it really shouldn't lock up the system for
multiple seconds at a time. And yet that's what it would need to be
doing to account for the tps discrepancy on this test, considering how
rarely it occurs.
Studying AdvanceXLInsertBuffer() a bit more, I'm wondering if the
problem isn't so much - or isn't only - that it's expensive to write
buffers while also holding WALInsertLock. Maybe it's too expensive
even to acquire WalWriteLock in the first place - that is, the real
problem isn't so much the wraparound condition itself, but the expense
of testing whether a possible wraparound has actually occurred. A
quick test suggests that we acquire WALWriteLock here much more often
than we actually write anything while holding it, and that we get a
big burst of WALWriteLock acquisitions here immediately after a
checkpoint. I don't have any proof that this is what's causing the
tps drop with smaller wal_buffers, but I think there has to be
something other than an actual wraparound condition causing problems
here, because that just doesn't seem to happen frequently enough to be
an issue.
Anyway, maybe none of that matters at the moment. Perhaps it's enough
to know that wal_buffers>16MB can help, and just bump up the maximum
auto-tuned value a bit.
--
Robert Haas
EnterpriseDB: http://www.enterprisedb.com
The Enterprise PostgreSQL Company
| From: | Jeff Janes <jeff(dot)janes(at)gmail(dot)com> |
|---|---|
| To: | Robert Haas <robertmhaas(at)gmail(dot)com> |
| Cc: | pgsql-hackers(at)postgresql(dot)org |
| Subject: | Re: wal_buffers, redux |
| Date: | 2012-03-12 16:32:55 |
| Message-ID: | CAMkU=1zcHBzqz-kd+KPTxuVX+c5KAiSbSJ+U7+BcDh_OCd_b0Q@mail.gmail.com |
| Views: | Raw Message | Whole Thread | Download mbox | Resend email |
| Lists: | pgsql-hackers |
On Sat, Mar 10, 2012 at 7:55 PM, Robert Haas <robertmhaas(at)gmail(dot)com> wrote:
> I've finally been able to run some more tests of the effect of
> adjusting wal_buffers to values higher than 16MB. I ran the test on
> the 16 core (x 4 hw threads/core) IBM POWER7 machine, with my usual
> configuration settings:
>
> shared_buffers = 8GB
> maintenance_work_mem = 1GB
> synchronous_commit = off
> checkpoint_segments = 300
> checkpoint_timeout = 15min
> checkpoint_completion_target = 0.9
> wal_writer_delay = 20ms
>
> I ran three 30-minute tests at scale factor 300 with wal_buffers set
> at various values from 16MB up to 160MB, in multiples of 16MB, using
> pgbench with 32 clients and 32 threads in each case. The short
> version is that 32MB seems to be significantly better than 16MB, by
> about 1000 tps, and after that it gets murky; full results are below.
On Nate Boley's machine, the difference was ~100% increase rather than
~10%. Do you think the difference is in the CPU architecture, or the
IO subsystem?
Also, do you have the latency numbers?
Cheers,
Jeff
| From: | Robert Haas <robertmhaas(at)gmail(dot)com> |
|---|---|
| To: | Jeff Janes <jeff(dot)janes(at)gmail(dot)com> |
| Cc: | pgsql-hackers(at)postgresql(dot)org |
| Subject: | Re: wal_buffers, redux |
| Date: | 2012-03-12 17:55:26 |
| Message-ID: | CA+TgmoZwdieQoSRn=riLs0uJJF3EefkQD2cA8ZDoXiA7esvkYA@mail.gmail.com |
| Views: | Raw Message | Whole Thread | Download mbox | Resend email |
| Lists: | pgsql-hackers |
On Mon, Mar 12, 2012 at 12:32 PM, Jeff Janes <jeff(dot)janes(at)gmail(dot)com> wrote:
> On Nate Boley's machine, the difference was ~100% increase rather than
> ~10%.
Oh, right. I had forgotten how dramatic the changes were in those
test runs. I guess I should be happy that the absolute numbers on
this machine were as high as they were. This machine seems to be
beating that one on every metric.
> Do you think the difference is in the CPU architecture, or the
> IO subsystem?
That is an excellent question. I tried looking at vmstat output, but
a funny thing kept happening: periodically, the iowait column would
show a gigantic negative number instead of a number between 0 and 100.
This makes me a little chary of believing any of it. Even if I did,
I'm not sure that would fully answer the question. So I guess the
short answer is that I don't know, and I'm not even sure how I might
go about figuring it out. Any ideas?
> Also, do you have the latency numbers?
Not at the moment, but I'll generate them.
--
Robert Haas
EnterpriseDB: http://www.enterprisedb.com
The Enterprise PostgreSQL Company
| From: | Jeff Janes <jeff(dot)janes(at)gmail(dot)com> |
|---|---|
| To: | Robert Haas <robertmhaas(at)gmail(dot)com> |
| Cc: | pgsql-hackers(at)postgresql(dot)org |
| Subject: | Re: wal_buffers, redux |
| Date: | 2012-03-12 20:45:46 |
| Message-ID: | CAMkU=1yZQF8_aQCs2VjfJBLY=AYLSc7tr3rWSK3o=xveamx+Hw@mail.gmail.com |
| Views: | Raw Message | Whole Thread | Download mbox | Resend email |
| Lists: | pgsql-hackers |
On Mon, Mar 12, 2012 at 10:55 AM, Robert Haas <robertmhaas(at)gmail(dot)com> wrote:
> On Mon, Mar 12, 2012 at 12:32 PM, Jeff Janes <jeff(dot)janes(at)gmail(dot)com> wrote:
>> On Nate Boley's machine, the difference was ~100% increase rather than
>> ~10%.
>
> Oh, right. I had forgotten how dramatic the changes were in those
> test runs. I guess I should be happy that the absolute numbers on
> this machine were as high as they were. This machine seems to be
> beating that one on every metric.
>
>> Do you think the difference is in the CPU architecture, or the
>> IO subsystem?
>
> That is an excellent question. I tried looking at vmstat output, but
> a funny thing kept happening: periodically, the iowait column would
> show a gigantic negative number instead of a number between 0 and 100.
On which machine was that happening?
> This makes me a little chary of believing any of it. Even if I did,
> I'm not sure that would fully answer the question. So I guess the
> short answer is that I don't know, and I'm not even sure how I might
> go about figuring it out. Any ideas?
Rerunning all 4 benchmarks (both 16MB and 32MB wal_buffers on both
machines) with fsync=off (as well as synchronous_commit=off still)
might help clarify things.
If it increases the TPS of Nate(at)16MB, but doesn't change the other 3
situations much, then that suggests the IO system is driving it.
Basically moving up to 32MB is partially innoculating against slow
fsyncs upon log switch on that machine.
Does the POWER7 have a nonvolatile cache? What happened with
synchronous_commit=on?
Also, since all data fits in shared_buffers, making
checkpoint_segments and checkpoint_timeout be larger than the
benchmark period should remove the only other source of writing from
the system. With no checkpoints, no evictions, and no fysncs, it is
unlikely for the remaining IO to be the bottleneck.
Cheers,
Jeff
| From: | Robert Haas <robertmhaas(at)gmail(dot)com> |
|---|---|
| To: | Jeff Janes <jeff(dot)janes(at)gmail(dot)com> |
| Cc: | pgsql-hackers(at)postgresql(dot)org |
| Subject: | Re: wal_buffers, redux |
| Date: | 2012-03-13 02:26:34 |
| Message-ID: | CA+TgmoYkQwNeFPB8xMawApY2qV1bjVW558WJXXc4x+ik0Zf3yg@mail.gmail.com |
| Views: | Raw Message | Whole Thread | Download mbox | Resend email |
| Lists: | pgsql-hackers |
On Mon, Mar 12, 2012 at 4:45 PM, Jeff Janes <jeff(dot)janes(at)gmail(dot)com> wrote:
>>> Do you think the difference is in the CPU architecture, or the
>>> IO subsystem?
>>
>> That is an excellent question. I tried looking at vmstat output, but
>> a funny thing kept happening: periodically, the iowait column would
>> show a gigantic negative number instead of a number between 0 and 100.
>
> On which machine was that happening?
The IBM server.
>> This makes me a little chary of believing any of it. Even if I did,
>> I'm not sure that would fully answer the question. So I guess the
>> short answer is that I don't know, and I'm not even sure how I might
>> go about figuring it out. Any ideas?
>
> Rerunning all 4 benchmarks (both 16MB and 32MB wal_buffers on both
> machines) with fsync=off (as well as synchronous_commit=off still)
> might help clarify things.
> If it increases the TPS of Nate(at)16MB, but doesn't change the other 3
> situations much, then that suggests the IO system is driving it.
> Basically moving up to 32MB is partially innoculating against slow
> fsyncs upon log switch on that machine.
Mmm, yeah. Although, I think it might have been 64MB rather than 32MB
that I tested on that machine.
> Does the POWER7 have a nonvolatile cache? What happened with
> synchronous_commit=on?
Haven't tried that yet.
> Also, since all data fits in shared_buffers, making
> checkpoint_segments and checkpoint_timeout be larger than the
> benchmark period should remove the only other source of writing from
> the system. With no checkpoints, no evictions, and no fysncs, it is
> unlikely for the remaining IO to be the bottleneck.
Another thing to test.
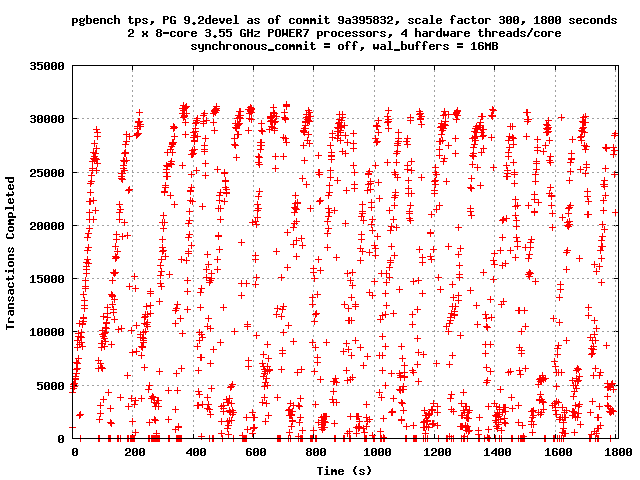
Meanwhile, here are some TPS graphs at 16MB and 32MB on the IBM POWER7
machine. 32 clients, 1800 seconds, scale factor 300, synchronous
commit off.
--
Robert Haas
EnterpriseDB: http://www.enterprisedb.com
The Enterprise PostgreSQL Company
| Attachment | Content-Type | Size |
|---|---|---|
|
image/png | 15.3 KB |

|
image/png | 16.2 KB |
| From: | Andres Freund <andres(at)anarazel(dot)de> |
|---|---|
| To: | pgsql-hackers(at)postgresql(dot)org |
| Cc: | Robert Haas <robertmhaas(at)gmail(dot)com>, Jeff Janes <jeff(dot)janes(at)gmail(dot)com> |
| Subject: | Re: wal_buffers, redux |
| Date: | 2012-03-13 08:55:04 |
| Message-ID: | 201203130955.05030.andres@anarazel.de |
| Views: | Raw Message | Whole Thread | Download mbox | Resend email |
| Lists: | pgsql-hackers |
On Tuesday, March 13, 2012 03:26:34 AM Robert Haas wrote:
> Meanwhile, here are some TPS graphs at 16MB and 32MB on the IBM POWER7
> machine. 32 clients, 1800 seconds, scale factor 300, synchronous
> commit off.
That graph makes me cringe because its pretty representative of what I have
seen in practise. Any chance we can get a ~10s average in there? I find it
pretty hard to read more than "spikey".
Whats the filesystem + options on this?
Andres
| From: | Robert Haas <robertmhaas(at)gmail(dot)com> |
|---|---|
| To: | Jeff Janes <jeff(dot)janes(at)gmail(dot)com> |
| Cc: | pgsql-hackers(at)postgresql(dot)org |
| Subject: | Re: wal_buffers, redux |
| Date: | 2012-03-13 12:43:13 |
| Message-ID: | CA+TgmoZABESSF+WKnJcfHToYjr8XAsDf0B2V0LDoDbiiBXpg+w@mail.gmail.com |
| Views: | Raw Message | Whole Thread | Download mbox | Resend email |
| Lists: | pgsql-hackers |
On Mon, Mar 12, 2012 at 4:45 PM, Jeff Janes <jeff(dot)janes(at)gmail(dot)com> wrote:
> Rerunning all 4 benchmarks (both 16MB and 32MB wal_buffers on both
> machines) with fsync=off (as well as synchronous_commit=off still)
> might help clarify things.
> If it increases the TPS of Nate(at)16MB, but doesn't change the other 3
> situations much, then that suggests the IO system is driving it.
> Basically moving up to 32MB is partially innoculating against slow
> fsyncs upon log switch on that machine.
I had the idea of running pg_test_fsync on each machine. Here, for
what it's worth, are the numbers.
Nate Boley's box:
2 seconds per test
O_DIRECT supported on this platform for open_datasync and open_sync.
Compare file sync methods using one 8kB write:
(in wal_sync_method preference order, except fdatasync
is Linux's default)
open_datasync 116.604 ops/sec
fdatasync 108.654 ops/sec
fsync 20.234 ops/sec
fsync_writethrough n/a
open_sync 17.979 ops/sec
Compare file sync methods using two 8kB writes:
(in wal_sync_method preference order, except fdatasync
is Linux's default)
open_datasync 39.833 ops/sec
fdatasync 58.072 ops/sec
fsync 19.756 ops/sec
fsync_writethrough n/a
open_sync 8.425 ops/sec
Compare open_sync with different write sizes:
(This is designed to compare the cost of writing 16kB
in different write open_sync sizes.)
1 * 16kB open_sync write 17.408 ops/sec
2 * 8kB open_sync writes 9.376 ops/sec
4 * 4kB open_sync writes 4.912 ops/sec
8 * 2kB open_sync writes 2.477 ops/sec
16 * 1kB open_sync writes 1.244 ops/sec
Test if fsync on non-write file descriptor is honored:
(If the times are similar, fsync() can sync data written
on a different descriptor.)
write, fsync, close 19.818 ops/sec
write, close, fsync 19.086 ops/sec
Non-Sync'ed 8kB writes:
write 101176.089 ops/sec
IBM POWER7 server:
2 seconds per test
O_DIRECT supported on this platform for open_datasync and open_sync.
Compare file sync methods using one 8kB write:
(in wal_sync_method preference order, except fdatasync
is Linux's default)
open_datasync 167.009 ops/sec
fdatasync 167.091 ops/sec
fsync 47.321 ops/sec
fsync_writethrough n/a
open_sync 53.735 ops/sec
Compare file sync methods using two 8kB writes:
(in wal_sync_method preference order, except fdatasync
is Linux's default)
open_datasync 68.891 ops/sec
fdatasync 164.597 ops/sec
fsync 50.334 ops/sec
fsync_writethrough n/a
open_sync 25.240 ops/sec
Compare open_sync with different write sizes:
(This is designed to compare the cost of writing 16kB
in different write open_sync sizes.)
1 * 16kB open_sync write 53.305 ops/sec
2 * 8kB open_sync writes 23.863 ops/sec
4 * 4kB open_sync writes 12.500 ops/sec
8 * 2kB open_sync writes 4.734 ops/sec
16 * 1kB open_sync writes 3.063 ops/sec
Test if fsync on non-write file descriptor is honored:
(If the times are similar, fsync() can sync data written
on a different descriptor.)
write, fsync, close 48.730 ops/sec
write, close, fsync 48.463 ops/sec
Non-Sync'ed 8kB writes:
write 186465.321 ops/sec
I can't rerun any more serious benchmarks on Nate Boley's box right
now due to other activity on the box.
--
Robert Haas
EnterpriseDB: http://www.enterprisedb.com
The Enterprise PostgreSQL Company
| From: | Robert Haas <robertmhaas(at)gmail(dot)com> |
|---|---|
| To: | Jeff Janes <jeff(dot)janes(at)gmail(dot)com> |
| Cc: | pgsql-hackers(at)postgresql(dot)org |
| Subject: | Re: wal_buffers, redux |
| Date: | 2012-03-13 19:48:32 |
| Message-ID: | CA+TgmobSzuco2-P5NSuup879jinFPMOSZcuNENjK+JU86aAoCQ@mail.gmail.com |
| Views: | Raw Message | Whole Thread | Download mbox | Resend email |
| Lists: | pgsql-hackers |
On Mon, Mar 12, 2012 at 4:45 PM, Jeff Janes <jeff(dot)janes(at)gmail(dot)com> wrote:
> Rerunning all 4 benchmarks (both 16MB and 32MB wal_buffers on both
> machines) with fsync=off (as well as synchronous_commit=off still)
> might help clarify things.
I reran the 32-client benchmark on the IBM machine with fsync=off and got this:
32MB: tps = 26809.442903 (including connections establishing)
16MB: tps = 26651.320145 (including connections establishing)
That's a speedup of nearly a factor of two, so clearly fsync-related
stalls are a big problem here, even with wal_buffers cranked up
through the ceiling.
--
Robert Haas
EnterpriseDB: http://www.enterprisedb.com
The Enterprise PostgreSQL Company
| From: | Robert Haas <robertmhaas(at)gmail(dot)com> |
|---|---|
| To: | Jeff Janes <jeff(dot)janes(at)gmail(dot)com> |
| Cc: | pgsql-hackers(at)postgresql(dot)org |
| Subject: | Re: wal_buffers, redux |
| Date: | 2012-03-13 22:20:46 |
| Message-ID: | CA+TgmoYwLbSkJ6b-L2w+PUPXeGBFQKT4B7-HG+S08q8YKvUTkQ@mail.gmail.com |
| Views: | Raw Message | Whole Thread | Download mbox | Resend email |
| Lists: | pgsql-hackers |
On Tue, Mar 13, 2012 at 3:48 PM, Robert Haas <robertmhaas(at)gmail(dot)com> wrote:
> On Mon, Mar 12, 2012 at 4:45 PM, Jeff Janes <jeff(dot)janes(at)gmail(dot)com> wrote:
>> Rerunning all 4 benchmarks (both 16MB and 32MB wal_buffers on both
>> machines) with fsync=off (as well as synchronous_commit=off still)
>> might help clarify things.
>
> I reran the 32-client benchmark on the IBM machine with fsync=off and got this:
>
> 32MB: tps = 26809.442903 (including connections establishing)
> 16MB: tps = 26651.320145 (including connections establishing)
>
> That's a speedup of nearly a factor of two, so clearly fsync-related
> stalls are a big problem here, even with wal_buffers cranked up
> through the ceiling.
And here's a tps plot with wal_buffers = 16MB, fsync = off. The
performance still bounces up and down, so there's obviously some other
factor contributing to latency spikes, but equally clearly, needing to
wait for fsyncs makes it a lot worse. I bet if we could understand
why that happens, we could improve things here a good deal.
--
Robert Haas
EnterpriseDB: http://www.enterprisedb.com
The Enterprise PostgreSQL Company
| Attachment | Content-Type | Size |
|---|---|---|

|
image/png | 13.9 KB |
| From: | Robert Haas <robertmhaas(at)gmail(dot)com> |
|---|---|
| To: | Andres Freund <andres(at)anarazel(dot)de> |
| Cc: | pgsql-hackers(at)postgresql(dot)org, Jeff Janes <jeff(dot)janes(at)gmail(dot)com> |
| Subject: | Re: wal_buffers, redux |
| Date: | 2012-03-13 22:23:33 |
| Message-ID: | CA+TgmoYKy8+bp4UoF3tS0hYpcfJ5q+pz7w6bEJu+GqiW=_g8Ng@mail.gmail.com |
| Views: | Raw Message | Whole Thread | Download mbox | Resend email |
| Lists: | pgsql-hackers |
On Tue, Mar 13, 2012 at 4:55 AM, Andres Freund <andres(at)anarazel(dot)de> wrote:
> On Tuesday, March 13, 2012 03:26:34 AM Robert Haas wrote:
>> Meanwhile, here are some TPS graphs at 16MB and 32MB on the IBM POWER7
>> machine. 32 clients, 1800 seconds, scale factor 300, synchronous
>> commit off.
> That graph makes me cringe because its pretty representative of what I have
> seen in practise. Any chance we can get a ~10s average in there? I find it
> pretty hard to read more than "spikey".
I tried that but don't find it an improvement; however I'm attaching
an example for your consideration.
> Whats the filesystem + options on this?
ext4, default options. Fedora 16, 3.2.6-3.fc16.ppc64.
--
Robert Haas
EnterpriseDB: http://www.enterprisedb.com
The Enterprise PostgreSQL Company
| Attachment | Content-Type | Size |
|---|---|---|

|
image/png | 10.1 KB |
| From: | Josh Berkus <josh(at)agliodbs(dot)com> |
|---|---|
| To: | pgsql-hackers(at)postgresql(dot)org |
| Subject: | Re: wal_buffers, redux |
| Date: | 2012-03-13 22:44:20 |
| Message-ID: | 4F5FCDC4.5060406@agliodbs.com |
| Views: | Raw Message | Whole Thread | Download mbox | Resend email |
| Lists: | pgsql-hackers |
> That's a speedup of nearly a factor of two, so clearly fsync-related
> stalls are a big problem here, even with wal_buffers cranked up
> through the ceiling.
Hmmmm. Do you have any ability to test on XFS?
--
Josh Berkus
PostgreSQL Experts Inc.
http://pgexperts.com
| From: | Fujii Masao <masao(dot)fujii(at)gmail(dot)com> |
|---|---|
| To: | Robert Haas <robertmhaas(at)gmail(dot)com> |
| Cc: | Jeff Janes <jeff(dot)janes(at)gmail(dot)com>, pgsql-hackers(at)postgresql(dot)org |
| Subject: | Re: wal_buffers, redux |
| Date: | 2012-03-14 02:02:24 |
| Message-ID: | CAHGQGwEgcj=i=yxshFnQ5YDPmYpmnxRPddpFcO+CZLG8xfYRgA@mail.gmail.com |
| Views: | Raw Message | Whole Thread | Download mbox | Resend email |
| Lists: | pgsql-hackers |
On Wed, Mar 14, 2012 at 7:20 AM, Robert Haas <robertmhaas(at)gmail(dot)com> wrote:
> On Tue, Mar 13, 2012 at 3:48 PM, Robert Haas <robertmhaas(at)gmail(dot)com> wrote:
>> On Mon, Mar 12, 2012 at 4:45 PM, Jeff Janes <jeff(dot)janes(at)gmail(dot)com> wrote:
>>> Rerunning all 4 benchmarks (both 16MB and 32MB wal_buffers on both
>>> machines) with fsync=off (as well as synchronous_commit=off still)
>>> might help clarify things.
>>
>> I reran the 32-client benchmark on the IBM machine with fsync=off and got this:
>>
>> 32MB: tps = 26809.442903 (including connections establishing)
>> 16MB: tps = 26651.320145 (including connections establishing)
>>
>> That's a speedup of nearly a factor of two, so clearly fsync-related
>> stalls are a big problem here, even with wal_buffers cranked up
>> through the ceiling.
>
> And here's a tps plot with wal_buffers = 16MB, fsync = off. The
> performance still bounces up and down, so there's obviously some other
> factor contributing to latency spikes
Initialization of WAL file? Do the latency spikes disappear if you start
benchmark after you prepare lots of the recycled WAL files?
Regards,
--
Fujii Masao
NIPPON TELEGRAPH AND TELEPHONE CORPORATION
NTT Open Source Software Center
| From: | Robert Haas <robertmhaas(at)gmail(dot)com> |
|---|---|
| To: | Fujii Masao <masao(dot)fujii(at)gmail(dot)com> |
| Cc: | Jeff Janes <jeff(dot)janes(at)gmail(dot)com>, pgsql-hackers(at)postgresql(dot)org |
| Subject: | Re: wal_buffers, redux |
| Date: | 2012-03-14 02:21:54 |
| Message-ID: | CA+Tgmob3=c2t=cmGQd_yhBM7AmtXhOmbG+=p4WDKcFPmhKDycg@mail.gmail.com |
| Views: | Raw Message | Whole Thread | Download mbox | Resend email |
| Lists: | pgsql-hackers |
On Tue, Mar 13, 2012 at 10:02 PM, Fujii Masao <masao(dot)fujii(at)gmail(dot)com> wrote:
> On Wed, Mar 14, 2012 at 7:20 AM, Robert Haas <robertmhaas(at)gmail(dot)com> wrote:
>> On Tue, Mar 13, 2012 at 3:48 PM, Robert Haas <robertmhaas(at)gmail(dot)com> wrote:
>>> On Mon, Mar 12, 2012 at 4:45 PM, Jeff Janes <jeff(dot)janes(at)gmail(dot)com> wrote:
>>>> Rerunning all 4 benchmarks (both 16MB and 32MB wal_buffers on both
>>>> machines) with fsync=off (as well as synchronous_commit=off still)
>>>> might help clarify things.
>>>
>>> I reran the 32-client benchmark on the IBM machine with fsync=off and got this:
>>>
>>> 32MB: tps = 26809.442903 (including connections establishing)
>>> 16MB: tps = 26651.320145 (including connections establishing)
>>>
>>> That's a speedup of nearly a factor of two, so clearly fsync-related
>>> stalls are a big problem here, even with wal_buffers cranked up
>>> through the ceiling.
>>
>> And here's a tps plot with wal_buffers = 16MB, fsync = off. The
>> performance still bounces up and down, so there's obviously some other
>> factor contributing to latency spikes
>
> Initialization of WAL file? Do the latency spikes disappear if you start
> benchmark after you prepare lots of the recycled WAL files?
The latency spikes seem to correspond to checkpoints, so I don't think
that's it.
--
Robert Haas
EnterpriseDB: http://www.enterprisedb.com
The Enterprise PostgreSQL Company
| From: | Robert Haas <robertmhaas(at)gmail(dot)com> |
|---|---|
| To: | Josh Berkus <josh(at)agliodbs(dot)com> |
| Cc: | pgsql-hackers(at)postgresql(dot)org |
| Subject: | Re: wal_buffers, redux |
| Date: | 2012-03-14 03:18:59 |
| Message-ID: | CA+TgmobjYLxLojw2SaDnPX6ch7LtbdrK0QSJ5czsTXiVg8OTCA@mail.gmail.com |
| Views: | Raw Message | Whole Thread | Download mbox | Resend email |
| Lists: | pgsql-hackers |
On Tue, Mar 13, 2012 at 6:44 PM, Josh Berkus <josh(at)agliodbs(dot)com> wrote:
>> That's a speedup of nearly a factor of two, so clearly fsync-related
>> stalls are a big problem here, even with wal_buffers cranked up
>> through the ceiling.
>
> Hmmmm. Do you have any ability to test on XFS?
It seems I do.
XFS, with fsync = on:
tps = 14746.687499 (including connections establishing)
XFS, with fsync = off:
tps = 25121.876560 (including connections establishing)
No real dramatic difference there, maybe a bit slower.
On further thought, it may be that this is just a simple case of too
many checkpoints. With fsync=off, we don't have to actually write all
that dirty data back to disk. I'm going to try cranking up
checkpoint_segments and see what happens.
--
Robert Haas
EnterpriseDB: http://www.enterprisedb.com
The Enterprise PostgreSQL Company
| From: | Jeff Janes <jeff(dot)janes(at)gmail(dot)com> |
|---|---|
| To: | Robert Haas <robertmhaas(at)gmail(dot)com> |
| Cc: | Fujii Masao <masao(dot)fujii(at)gmail(dot)com>, pgsql-hackers(at)postgresql(dot)org |
| Subject: | Re: wal_buffers, redux |
| Date: | 2012-03-14 19:29:37 |
| Message-ID: | CAMkU=1wYpjqYA-phwk-WtkY8gfKSuz+jCTST9W9QmG32_MvZYg@mail.gmail.com |
| Views: | Raw Message | Whole Thread | Download mbox | Resend email |
| Lists: | pgsql-hackers |
On Mon, Mar 12, 2012 at 7:16 AM, Robert Haas <robertmhaas(at)gmail(dot)com> wrote:
> On Sun, Mar 11, 2012 at 11:51 PM, Fujii Masao <masao(dot)fujii(at)gmail(dot)com> wrote:
>> On Sun, Mar 11, 2012 at 12:55 PM, Robert Haas <robertmhaas(at)gmail(dot)com> wrote:
>>> I've finally been able to run some more tests of the effect of
>>> adjusting wal_buffers to values higher than 16MB. I ran the test on
>>> the 16 core (x 4 hw threads/core) IBM POWER7 machine, with my usual
>>> configuration settings:
>>>
>>> shared_buffers = 8GB
>>> maintenance_work_mem = 1GB
>>> synchronous_commit = off
>>> checkpoint_segments = 300
>>> checkpoint_timeout = 15min
>>> checkpoint_completion_target = 0.9
>>> wal_writer_delay = 20ms
>>>
>>> I ran three 30-minute tests at scale factor 300 with wal_buffers set
>>> at various values from 16MB up to 160MB, in multiples of 16MB, using
>>> pgbench with 32 clients and 32 threads in each case. The short
>>> version is that 32MB seems to be significantly better than 16MB, by
>>> about 1000 tps, and after that it gets murky; full results are below.
>>
>> Currently the max of wal_buffers is 16MB (i.e., the size of one WAL file)
>> when it's set to -1. Thanks to your result, we should increase the max to
>> 32MB?
>
> I think that might be a good idea, although I'm not entirely convinced
> that we understand why increasing wal_buffers is helping as much as it
> is. I stuck an elog() into AdvanceXLInsertBuffer() to complain in the
> case that we were writing buffers while holding the insert lock.
> Then, I reran 30-minute tests 32 clients, one with wal_buffers=16MB
> and the other wal_buffers=32MB. On the 16MB test, the elog() fired 15
> times in a single second shortly after the start of the test, and then
> 9 more times over the rest of the test. On the 32MB test, the elog()
> fired a total 6 times over the course of the test. The first test got
> 14320 tps, while the second got 15026 tps. I find that quite
> surprising, because although WAL buffer wraparound is certainly bad
> (on this test, it probably brings the system completely to a halt
> until fsync() finishes) it really shouldn't lock up the system for
> multiple seconds at a time. And yet that's what it would need to be
> doing to account for the tps discrepancy on this test, considering how
> rarely it occurs.
Where did you put the elog? If you put it near
TRACE_POSTGRESQL_WAL_BUFFER_WRITE_DIRTY_START(), it is probably too
late in the code.
If someone else (like the background wal writer) is blocked on an
fsync, then AdvanceXLInsertBuffer will block on getting the
WALWriteLock. Once it gets the lock, it will likely find it no longer
needs to do the write (because it was done by the thing that just
blocked and then released it), but at that point the damage has
already been done. The damage is not that it has to do a write, but
that it had to block (indirectly) on an fsync which it didn't really
care about.
One possibility is that the writer should update
xlogctl->LogwrtResult.Write between finishing the write and starting
the fsync. That way an AdvanceXLInsertBuffer that arrives during the
fsync could see that the data is needs to overwrite has already been
written, even if not yet fsynced, and that would be enough to allow it
proceed.
That would be ugly, because AdvanceXLInsertBuffer that arrives during
the write itself would check xlogctl and then block until the fsync
finished, with no way to wake up as soon as the write-part finished.
So making it work cleanly would require a redesign of the whole
locking scheme. Which the Scaling patch is already doing.
>
> Studying AdvanceXLInsertBuffer() a bit more, I'm wondering if the
> problem isn't so much - or isn't only - that it's expensive to write
> buffers while also holding WALInsertLock. Maybe it's too expensive
> even to acquire WalWriteLock in the first place - that is, the real
> problem isn't so much the wraparound condition itself, but the expense
> of testing whether a possible wraparound has actually occurred. A
> quick test suggests that we acquire WALWriteLock here much more often
> than we actually write anything while holding it, and that we get a
> big burst of WALWriteLock acquisitions here immediately after a
> checkpoint. I don't have any proof that this is what's causing the
> tps drop with smaller wal_buffers, but I think there has to be
> something other than an actual wraparound condition causing problems
> here, because that just doesn't seem to happen frequently enough to be
> an issue.
I think my analysis is pretty much a re-wording of yours, but I'd
emphasize that getting the WALWriteLock is bad not just because they
fight over the lock, but because someone else (probably background wal
writer) is camping out on the lock while doing an fsync.
Cheers,
Jeff
| From: | Robert Haas <robertmhaas(at)gmail(dot)com> |
|---|---|
| To: | Josh Berkus <josh(at)agliodbs(dot)com> |
| Cc: | pgsql-hackers(at)postgresql(dot)org |
| Subject: | Re: wal_buffers, redux |
| Date: | 2012-03-14 20:52:30 |
| Message-ID: | CA+TgmoYfRjqaO8xT1O9yNr4_WivW3A4372rFTWhLSo0PLB1yGw@mail.gmail.com |
| Views: | Raw Message | Whole Thread | Download mbox | Resend email |
| Lists: | pgsql-hackers |
On Tue, Mar 13, 2012 at 11:18 PM, Robert Haas <robertmhaas(at)gmail(dot)com> wrote:
> On Tue, Mar 13, 2012 at 6:44 PM, Josh Berkus <josh(at)agliodbs(dot)com> wrote:
>>> That's a speedup of nearly a factor of two, so clearly fsync-related
>>> stalls are a big problem here, even with wal_buffers cranked up
>>> through the ceiling.
>>
>> Hmmmm. Do you have any ability to test on XFS?
>
> It seems I do.
>
> XFS, with fsync = on:
> tps = 14746.687499 (including connections establishing)
> XFS, with fsync = off:
> tps = 25121.876560 (including connections establishing)
>
> No real dramatic difference there, maybe a bit slower.
>
> On further thought, it may be that this is just a simple case of too
> many checkpoints. With fsync=off, we don't have to actually write all
> that dirty data back to disk. I'm going to try cranking up
> checkpoint_segments and see what happens.
OK, this is bizarre. I wiped out my XFS filesystem and put ext4 back,
and look at this:
tps = 19105.740878 (including connections establishing)
tps = 19687.674409 (including connections establishing)
That's a jump of nearly a third from before. I'm not sure what's
different. Nothing, AFAIK. I drop and recreate the database after
every test run, so I don't see why this should be so much better,
unless ext4 degrades over time (even though the FS is nearly empty,
and I'm dropping the whole database after each test run).
Then I tried it with checkpoint_segments=3000 rather than 300.
tps = 26750.190469 (including connections establishing)
Hmm, what happens with checkpoint_segments=3000 and fsync=off?
tps = 30395.583366 (including connections establishing)
Hmm, and what if I set checkpoint_segments=300 and fsync=off?
tps = 26029.160919 (including connections establishing)
Not sure what to make of all this, yet.
--
Robert Haas
EnterpriseDB: http://www.enterprisedb.com
The Enterprise PostgreSQL Company
| From: | Robert Haas <robertmhaas(at)gmail(dot)com> |
|---|---|
| To: | Jeff Janes <jeff(dot)janes(at)gmail(dot)com> |
| Cc: | Fujii Masao <masao(dot)fujii(at)gmail(dot)com>, pgsql-hackers(at)postgresql(dot)org |
| Subject: | Re: wal_buffers, redux |
| Date: | 2012-03-14 20:53:58 |
| Message-ID: | CA+TgmoYw0K+Dp55P1QttCirMBjgZ+srtW=vG2=dWrti2ddws4w@mail.gmail.com |
| Views: | Raw Message | Whole Thread | Download mbox | Resend email |
| Lists: | pgsql-hackers |
On Wed, Mar 14, 2012 at 3:29 PM, Jeff Janes <jeff(dot)janes(at)gmail(dot)com> wrote:
> I think my analysis is pretty much a re-wording of yours, but I'd
> emphasize that getting the WALWriteLock is bad not just because they
> fight over the lock, but because someone else (probably background wal
> writer) is camping out on the lock while doing an fsync.
Yeah, good point.
--
Robert Haas
EnterpriseDB: http://www.enterprisedb.com
The Enterprise PostgreSQL Company