| Lists: | pgsql-hackers |
|---|
| From: | Nils Goroll <slink(at)schokola(dot)de> |
|---|---|
| To: | pgsql-hackers(at)postgresql(dot)org |
| Subject: | why roll-your-own s_lock? / improving scalability |
| Date: | 2012-06-26 17:02:31 |
| Message-ID: | 4FE9EB27.9020502@schokola.de |
| Views: | Raw Message | Whole Thread | Download mbox | Resend email |
| Lists: | pgsql-hackers |
Hi,
I am currently trying to understand what looks like really bad scalability of
9.1.3 on a 64core 512GB RAM system: the system runs OK when at 30% usr, but only
marginal amounts of additional load seem to push it to 70% and the application
becomes highly unresponsive.
My current understanding basically matches the issues being addressed by various
9.2 improvements, well summarized in
http://wiki.postgresql.org/images/e/e8/FOSDEM2012-Multi-CPU-performance-in-9.2.pdf
An additional aspect is that, in order to address the latent risk of data loss &
corruption with WBCs and async replication, we have deliberately moved the db
from a similar system with WB cached storage to ssd based storage without a WBC,
which, by design, has (in the best WBC case) approx. 100x higher latencies, but
much higher sustained throughput.
On the new system, even with 30% user "acceptable" load, oprofile makes apparent
significant lock contention:
opreport --symbols --merge tgid -l /mnt/db1/hdd/pgsql-9.1/bin/postgres
Profiling through timer interrupt
samples % image name symbol name
30240 27.9720 postgres s_lock
5069 4.6888 postgres GetSnapshotData
3743 3.4623 postgres AllocSetAlloc
3167 2.9295 libc-2.12.so strcoll_l
2662 2.4624 postgres SearchCatCache
2495 2.3079 postgres hash_search_with_hash_value
2143 1.9823 postgres nocachegetattr
1860 1.7205 postgres LWLockAcquire
1642 1.5189 postgres base_yyparse
1604 1.4837 libc-2.12.so __strcmp_sse42
1543 1.4273 libc-2.12.so __strlen_sse42
1156 1.0693 libc-2.12.so memcpy
Unfortunately I don't have profiling data for the high-load / contention
condition yet, but I fear the picture will be worse and pointing in the same
direction.
<pure speculation>
In particular, the _impression_ is that lock contention could also be related to
I/O latencies making me fear that cases could exist where spin locks are being
helt while blocking on IO.
</pure speculation>
Looking at the code, it appears to me that the roll-your-own s_lock code cannot
handle a couple of cases, for instance it will also spin when the lock holder is
not running at all or blocking on IO (which could even be implicit, e.g. for a
page flush). These issues have long been addressed by adaptive mutexes and futexes.
Also, the s_lock code tries to be somehow adaptive using spins_per_delay (when
having spun for long (not not blocked), spin even longer in future), which
appears to me to have the potential of becoming highly counter-productive.
Now that the scene is set, here's the simple question: Why all this? Why not
simply use posix mutexes which, on modern platforms, will map to efficient
implementations like adaptive mutexes or futexes?
Thanks, Nils
| From: | Merlin Moncure <mmoncure(at)gmail(dot)com> |
|---|---|
| To: | Nils Goroll <slink(at)schokola(dot)de> |
| Cc: | pgsql-hackers(at)postgresql(dot)org |
| Subject: | Re: why roll-your-own s_lock? / improving scalability |
| Date: | 2012-06-26 18:46:06 |
| Message-ID: | CAHyXU0zKwJGbGw_oDUKimxYZoNc7q5+fbtiOynM3Cq5ZqzKH9A@mail.gmail.com |
| Views: | Raw Message | Whole Thread | Download mbox | Resend email |
| Lists: | pgsql-hackers |
On Tue, Jun 26, 2012 at 12:02 PM, Nils Goroll <slink(at)schokola(dot)de> wrote:
> Hi,
>
> I am currently trying to understand what looks like really bad scalability of
> 9.1.3 on a 64core 512GB RAM system: the system runs OK when at 30% usr, but only
> marginal amounts of additional load seem to push it to 70% and the application
> becomes highly unresponsive.
>
> My current understanding basically matches the issues being addressed by various
> 9.2 improvements, well summarized in
> http://wiki.postgresql.org/images/e/e8/FOSDEM2012-Multi-CPU-performance-in-9.2.pdf
>
> An additional aspect is that, in order to address the latent risk of data loss &
> corruption with WBCs and async replication, we have deliberately moved the db
> from a similar system with WB cached storage to ssd based storage without a WBC,
> which, by design, has (in the best WBC case) approx. 100x higher latencies, but
> much higher sustained throughput.
>
>
> On the new system, even with 30% user "acceptable" load, oprofile makes apparent
> significant lock contention:
>
> opreport --symbols --merge tgid -l /mnt/db1/hdd/pgsql-9.1/bin/postgres
>
>
> Profiling through timer interrupt
> samples % image name symbol name
> 30240 27.9720 postgres s_lock
> 5069 4.6888 postgres GetSnapshotData
> 3743 3.4623 postgres AllocSetAlloc
> 3167 2.9295 libc-2.12.so strcoll_l
> 2662 2.4624 postgres SearchCatCache
> 2495 2.3079 postgres hash_search_with_hash_value
> 2143 1.9823 postgres nocachegetattr
> 1860 1.7205 postgres LWLockAcquire
> 1642 1.5189 postgres base_yyparse
> 1604 1.4837 libc-2.12.so __strcmp_sse42
> 1543 1.4273 libc-2.12.so __strlen_sse42
> 1156 1.0693 libc-2.12.so memcpy
>
> Unfortunately I don't have profiling data for the high-load / contention
> condition yet, but I fear the picture will be worse and pointing in the same
> direction.
>
> <pure speculation>
> In particular, the _impression_ is that lock contention could also be related to
> I/O latencies making me fear that cases could exist where spin locks are being
> helt while blocking on IO.
> </pure speculation>
>
>
> Looking at the code, it appears to me that the roll-your-own s_lock code cannot
> handle a couple of cases, for instance it will also spin when the lock holder is
> not running at all or blocking on IO (which could even be implicit, e.g. for a
> page flush). These issues have long been addressed by adaptive mutexes and futexes.
>
> Also, the s_lock code tries to be somehow adaptive using spins_per_delay (when
> having spun for long (not not blocked), spin even longer in future), which
> appears to me to have the potential of becoming highly counter-productive.
>
>
> Now that the scene is set, here's the simple question: Why all this? Why not
> simply use posix mutexes which, on modern platforms, will map to efficient
> implementations like adaptive mutexes or futexes?
Well, that would introduce a backend dependency on pthreads, which is
unpleasant. Also you'd need to feature test via
_POSIX_THREAD_PROCESS_SHARED to make sure you can mutex between
processes (and configure your mutexes as such when you do). There are
probably other reasons why this can't be done, but I personally don' t
klnow of any.
Also, it's forbidden to do things like invoke i/o in the backend while
holding only a spinlock. As to your larger point, it's an interesting
assertion -- some data to back it up would help.
merlin
| From: | Tom Lane <tgl(at)sss(dot)pgh(dot)pa(dot)us> |
|---|---|
| To: | Nils Goroll <slink(at)schokola(dot)de> |
| Cc: | pgsql-hackers(at)postgresql(dot)org |
| Subject: | Re: why roll-your-own s_lock? / improving scalability |
| Date: | 2012-06-26 18:50:51 |
| Message-ID: | 10706.1340736651@sss.pgh.pa.us |
| Views: | Raw Message | Whole Thread | Download mbox | Resend email |
| Lists: | pgsql-hackers |
Nils Goroll <slink(at)schokola(dot)de> writes:
> Now that the scene is set, here's the simple question: Why all this? Why not
> simply use posix mutexes which, on modern platforms, will map to efficient
> implementations like adaptive mutexes or futexes?
(1) They do not exist everywhere.
(2) There is absolutely no evidence to suggest that they'd make things better.
If someone cared to rectify (2), we could consider how to use them as an
alternative implementation. But if you start with "let's not support
any platforms that don't have this feature", you're going to get a cold
reception.
regards, tom lane
| From: | Nils Goroll <slink(at)schokola(dot)de> |
|---|---|
| To: | Merlin Moncure <mmoncure(at)gmail(dot)com> |
| Cc: | pgsql-hackers(at)postgresql(dot)org |
| Subject: | Re: why roll-your-own s_lock? / improving scalability |
| Date: | 2012-06-26 19:05:12 |
| Message-ID: | 4FEA07E8.6020904@schokola.de |
| Views: | Raw Message | Whole Thread | Download mbox | Resend email |
| Lists: | pgsql-hackers |
Hi Merlin,
> _POSIX_THREAD_PROCESS_SHARED
sure.
> Also, it's forbidden to do things like invoke i/o in the backend while
> holding only a spinlock. As to your larger point, it's an interesting
> assertion -- some data to back it up would help.
Let's see if I can get any. ATM I've only got indications, but no proof.
Nils
| From: | Nils Goroll <slink(at)schokola(dot)de> |
|---|---|
| To: | Tom Lane <tgl(at)sss(dot)pgh(dot)pa(dot)us> |
| Cc: | pgsql-hackers(at)postgresql(dot)org |
| Subject: | Re: why roll-your-own s_lock? / improving scalability |
| Date: | 2012-06-26 19:06:02 |
| Message-ID: | 4FEA081A.2030506@schokola.de |
| Views: | Raw Message | Whole Thread | Download mbox | Resend email |
| Lists: | pgsql-hackers |
> But if you start with "let's not support any platforms that don't have this feature"
This will never be my intention.
Nils
| From: | Martijn van Oosterhout <kleptog(at)svana(dot)org> |
|---|---|
| To: | Merlin Moncure <mmoncure(at)gmail(dot)com> |
| Cc: | Nils Goroll <slink(at)schokola(dot)de>, pgsql-hackers(at)postgresql(dot)org |
| Subject: | Re: why roll-your-own s_lock? / improving scalability |
| Date: | 2012-06-26 21:44:42 |
| Message-ID: | 20120626214442.GA13553@svana.org |
| Views: | Raw Message | Whole Thread | Download mbox | Resend email |
| Lists: | pgsql-hackers |
On Tue, Jun 26, 2012 at 01:46:06PM -0500, Merlin Moncure wrote:
> Well, that would introduce a backend dependency on pthreads, which is
> unpleasant. Also you'd need to feature test via
> _POSIX_THREAD_PROCESS_SHARED to make sure you can mutex between
> processes (and configure your mutexes as such when you do). There are
> probably other reasons why this can't be done, but I personally don' t
> klnow of any.
And then you have fabulous things like:
https://git.reviewboard.kde.org/r/102145/
(OSX defines _POSIX_THREAD_PROCESS_SHARED but does not actually support
it.)
Seems not very well tested in any case.
It might be worthwhile testing futexes on Linux though, they are
specifically supported on any kind of shared memory (shm/mmap/fork/etc)
and quite well tested.
Have a nice day,
--
Martijn van Oosterhout <kleptog(at)svana(dot)org> http://svana.org/kleptog/
> He who writes carelessly confesses thereby at the very outset that he does
> not attach much importance to his own thoughts.
-- Arthur Schopenhauer
| From: | Tom Lane <tgl(at)sss(dot)pgh(dot)pa(dot)us> |
|---|---|
| To: | Martijn van Oosterhout <kleptog(at)svana(dot)org> |
| Cc: | Merlin Moncure <mmoncure(at)gmail(dot)com>, Nils Goroll <slink(at)schokola(dot)de>, pgsql-hackers(at)postgresql(dot)org |
| Subject: | Re: why roll-your-own s_lock? / improving scalability |
| Date: | 2012-06-26 22:12:19 |
| Message-ID: | 14481.1340748739@sss.pgh.pa.us |
| Views: | Raw Message | Whole Thread | Download mbox | Resend email |
| Lists: | pgsql-hackers |
Martijn van Oosterhout <kleptog(at)svana(dot)org> writes:
> And then you have fabulous things like:
> https://git.reviewboard.kde.org/r/102145/
> (OSX defines _POSIX_THREAD_PROCESS_SHARED but does not actually support
> it.)
> Seems not very well tested in any case.
> It might be worthwhile testing futexes on Linux though, they are
> specifically supported on any kind of shared memory (shm/mmap/fork/etc)
> and quite well tested.
Yeah, a Linux-specific replacement of spinlocks with futexes seems like
a lot safer idea than "let's rely on posix mutexes everywhere". It's
still unproven whether it'd be an improvement, but you could expect to
prove it one way or the other with a well-defined amount of testing.
regards, tom lane
| From: | Nils Goroll <slink(at)schokola(dot)de> |
|---|---|
| To: | Tom Lane <tgl(at)sss(dot)pgh(dot)pa(dot)us> |
| Cc: | Martijn van Oosterhout <kleptog(at)svana(dot)org>, Merlin Moncure <mmoncure(at)gmail(dot)com>, pgsql-hackers(at)postgresql(dot)org |
| Subject: | experimental: replace s_lock spinlock code with pthread_mutex on linux |
| Date: | 2012-06-26 22:58:47 |
| Message-ID: | 4FEA3EA7.1040104@schokola.de |
| Views: | Raw Message | Whole Thread | Download mbox | Resend email |
| Lists: | pgsql-hackers |
> It's
> still unproven whether it'd be an improvement, but you could expect to
> prove it one way or the other with a well-defined amount of testing.
I've hacked the code to use adaptive pthread mutexes instead of spinlocks. see
attached patch. The patch is for the git head, but it can easily be applied for
9.1.3, which is what I did for my tests.
This had disastrous effects on Solaris because it does not use anything similar
to futexes for PTHREAD_PROCESS_SHARED mutexes (only the _PRIVATE mutexes do
without syscalls for the simple case).
But I was surprised to see that it works relatively well on linux. Here's a
glimpse of my results:
hacked code 9.1.3:
-bash-4.1$ rsync -av --delete /tmp/test_template_data/ ../data/ ; /usr/bin/time
./postgres -D ../data -p 55502 & ppid=$! ; pid=$(pgrep -P $ppid ) ; sleep 15 ;
./pgbench -c 768 -t 20 -j 128 -p 55502 postgres ; kill $pid
sending incremental file list
...
ransaction type: TPC-B (sort of)
scaling factor: 10
query mode: simple
number of clients: 768
number of threads: 128
number of transactions per client: 20
number of transactions actually processed: 15360/15360
tps = 476.873261 (including connections establishing)
tps = 485.964355 (excluding connections establishing)
LOG: received smart shutdown request
LOG: autovacuum launcher shutting down
-bash-4.1$ LOG: shutting down
LOG: database system is shut down
210.58user 78.88system 0:50.64elapsed 571%CPU (0avgtext+0avgdata
1995968maxresident)k
0inputs+1153872outputs (0major+2464649minor)pagefaults 0swaps
original code (vanilla build on amd64) 9.1.3:
-bash-4.1$ rsync -av --delete /tmp/test_template_data/ ../data/ ; /usr/bin/time
./postgres -D ../data -p 55502 & ppid=$! ; pid=$(pgrep -P $ppid ) ; sleep 15 ;
./pgbench -c 768 -t 20 -j 128 -p 55502 postgres ; kill $pid
sending incremental file list
...
transaction type: TPC-B (sort of)
scaling factor: 10
query mode: simple
number of clients: 768
number of threads: 128
number of transactions per client: 20
number of transactions actually processed: 15360/15360
tps = 499.993685 (including connections establishing)
tps = 510.410883 (excluding connections establishing)
LOG: received smart shutdown request
-bash-4.1$ LOG: autovacuum launcher shutting down
LOG: shutting down
LOG: database system is shut down
196.21user 71.38system 0:47.99elapsed 557%CPU (0avgtext+0avgdata
1360800maxresident)k
0inputs+1147904outputs (0major+2375965minor)pagefaults 0swaps
config:
-bash-4.1$ egrep '^[a-z]' /tmp/test_template_data/postgresql.conf
max_connections = 1800 # (change requires restart)
shared_buffers = 10GB # min 128kB
temp_buffers = 64MB # min 800kB
work_mem = 256MB # min 64kB,d efault 1MB
maintenance_work_mem = 2GB # min 1MB, default 16MB
bgwriter_delay = 10ms # 10-10000ms between rounds
bgwriter_lru_maxpages = 1000 # 0-1000 max buffers written/round
bgwriter_lru_multiplier = 10.0 # 0-10.0 multipler on buffers scanned/round
wal_level = hot_standby # minimal, archive, or hot_standby
wal_buffers = 64MB # min 32kB, -1 sets based on shared_buffers
commit_delay = 10000 # range 0-100000, in microseconds
datestyle = 'iso, mdy'
lc_messages = 'en_US.UTF-8' # locale for system error message
lc_monetary = 'en_US.UTF-8' # locale for monetary formatting
lc_numeric = 'en_US.UTF-8' # locale for number formatting
lc_time = 'en_US.UTF-8' # locale for time formatting
default_text_search_config = 'pg_catalog.english'
seq_page_cost = 1.0 # measured on an arbitrary scale
random_page_cost = 1.5 # same scale as above (default: 4.0)
cpu_tuple_cost = 0.005
cpu_index_tuple_cost = 0.0025
cpu_operator_cost = 0.0001
effective_cache_size = 192GB
So it looks like using pthread_mutexes could at least be an option on Linux.
Using futexes directly could be even cheaper.
As a side note, it looks like I have not expressed myself clearly:
I did not intend to suggest to replace proven, working code (which probably is
the best you can get for some platforms) with posix calls. I apologize for the
provocative question.
Regarding the actual production issue, I did not manage to synthetically provoke
the saturation we are seeing in production using pgbench - I could not even get
anywhere near the production load. So I cannot currently test if reducing the
amount of spinning and waking up exactly one waiter (which is what linux/nptl
pthread_mutex_unlock does) would solve/mitigate the production issue I am
working on, and I'd highly appreciate any pointers in this direction.
Cheers, Nils
| Attachment | Content-Type | Size |
|---|---|---|
| experimental_linux_pthread_mutex_instead_of_spinlick.patch | text/plain | 4.9 KB |
| From: | Martijn van Oosterhout <kleptog(at)svana(dot)org> |
|---|---|
| To: | Nils Goroll <slink(at)schokola(dot)de> |
| Cc: | Tom Lane <tgl(at)sss(dot)pgh(dot)pa(dot)us>, Merlin Moncure <mmoncure(at)gmail(dot)com>, pgsql-hackers(at)postgresql(dot)org |
| Subject: | Re: experimental: replace s_lock spinlock code with pthread_mutex on linux |
| Date: | 2012-06-27 06:59:43 |
| Message-ID: | 20120627065943.GA25028@svana.org |
| Views: | Raw Message | Whole Thread | Download mbox | Resend email |
| Lists: | pgsql-hackers |
On Wed, Jun 27, 2012 at 12:58:47AM +0200, Nils Goroll wrote:
> So it looks like using pthread_mutexes could at least be an option on Linux.
>
> Using futexes directly could be even cheaper.
Note that below this you only have the futex(2) system call. Futexes
require all counter manipulation to happen in userspace, just like now,
so all the per architecture stuff remains. On Linux pthread mutexes
are really just a thin wrapper on top of this.
The futex(2) system call merely provides an interface for handling the
blocking and waking of other processes and releasing locks on process
exit (so everything can still work after a kill -9).
So it's more a replacement for the SysV semaphores than anything else.
Have a nice day,
--
Martijn van Oosterhout <kleptog(at)svana(dot)org> http://svana.org/kleptog/
> He who writes carelessly confesses thereby at the very outset that he does
> not attach much importance to his own thoughts.
-- Arthur Schopenhauer
| From: | Nils Goroll <slink(at)schokola(dot)de> |
|---|---|
| To: | Martijn van Oosterhout <kleptog(at)svana(dot)org> |
| Cc: | Tom Lane <tgl(at)sss(dot)pgh(dot)pa(dot)us>, Merlin Moncure <mmoncure(at)gmail(dot)com>, pgsql-hackers(at)postgresql(dot)org |
| Subject: | Re: experimental: replace s_lock spinlock code with pthread_mutex on linux |
| Date: | 2012-06-27 10:10:47 |
| Message-ID: | 4FEADC27.30100@schokola.de |
| Views: | Raw Message | Whole Thread | Download mbox | Resend email |
| Lists: | pgsql-hackers |
>> Using futexes directly could be even cheaper.
> Note that below this you only have the futex(2) system call.
I was only referring to the fact that we could save one function and one library
call, which could make a difference for the uncontended case.
| From: | Jeff Janes <jeff(dot)janes(at)gmail(dot)com> |
|---|---|
| To: | Nils Goroll <slink(at)schokola(dot)de> |
| Cc: | Tom Lane <tgl(at)sss(dot)pgh(dot)pa(dot)us>, Martijn van Oosterhout <kleptog(at)svana(dot)org>, Merlin Moncure <mmoncure(at)gmail(dot)com>, pgsql-hackers(at)postgresql(dot)org |
| Subject: | Re: experimental: replace s_lock spinlock code with pthread_mutex on linux |
| Date: | 2012-06-28 15:21:41 |
| Message-ID: | CAMkU=1z0Et+EZAP5JzuE+q640Uj=DjDv0nSU6Gorki9mJLxxXA@mail.gmail.com |
| Views: | Raw Message | Whole Thread | Download mbox | Resend email |
| Lists: | pgsql-hackers |
On Tue, Jun 26, 2012 at 3:58 PM, Nils Goroll <slink(at)schokola(dot)de> wrote:
>> It's
>> still unproven whether it'd be an improvement, but you could expect to
>> prove it one way or the other with a well-defined amount of testing.
>
> I've hacked the code to use adaptive pthread mutexes instead of spinlocks. see
> attached patch. The patch is for the git head, but it can easily be applied for
> 9.1.3, which is what I did for my tests.
>
> This had disastrous effects on Solaris because it does not use anything similar
> to futexes for PTHREAD_PROCESS_SHARED mutexes (only the _PRIVATE mutexes do
> without syscalls for the simple case).
>
> But I was surprised to see that it works relatively well on linux. Here's a
> glimpse of my results:
>
> hacked code 9.1.3:
...
> tps = 485.964355 (excluding connections establishing)
> original code (vanilla build on amd64) 9.1.3:
...
> tps = 510.410883 (excluding connections establishing)
It looks like the hacked code is slower than the original. That
doesn't seem so good to me. Am I misreading this?
Also, 20 transactions per connection is not enough of a run to make
any evaluation on.
How many cores are you testing on?
> Regarding the actual production issue, I did not manage to synthetically provoke
> the saturation we are seeing in production using pgbench - I could not even get
> anywhere near the production load.
What metrics/tools are you using to compare the two loads? What is
the production load like?
Each transaction has to update one of ten pgbench_branch rows, so you
can't have more than ten transactions productively active at any given
time, even though you have 768 connections. So you need to jack up
the pgbench scale, or switch to using -N mode.
Also, you should use -M prepared, otherwise you spend more time
parsing and planning the statements than executing them.
Cheers,
Jeff
| From: | Robert Haas <robertmhaas(at)gmail(dot)com> |
|---|---|
| To: | Jeff Janes <jeff(dot)janes(at)gmail(dot)com> |
| Cc: | Nils Goroll <slink(at)schokola(dot)de>, Tom Lane <tgl(at)sss(dot)pgh(dot)pa(dot)us>, Martijn van Oosterhout <kleptog(at)svana(dot)org>, Merlin Moncure <mmoncure(at)gmail(dot)com>, pgsql-hackers(at)postgresql(dot)org |
| Subject: | Re: experimental: replace s_lock spinlock code with pthread_mutex on linux |
| Date: | 2012-06-28 15:29:10 |
| Message-ID: | CA+TgmobwvB7GxxY=LZZALFwH8m8jgfzMuD-aYRPgxU0=w0pTeA@mail.gmail.com |
| Views: | Raw Message | Whole Thread | Download mbox | Resend email |
| Lists: | pgsql-hackers |
On Thu, Jun 28, 2012 at 11:21 AM, Jeff Janes <jeff(dot)janes(at)gmail(dot)com> wrote:
> Also, 20 transactions per connection is not enough of a run to make
> any evaluation on.
FWIW, I kicked off a looong benchmarking run on this a couple of days
ago on the IBM POWER7 box, testing pgbench -S, regular pgbench, and
pgbench --unlogged-tables at various client counts with and without
the patch; three half-hour test runs for each test configuration. It
should be done tonight and I will post the results once they're in.
--
Robert Haas
EnterpriseDB: http://www.enterprisedb.com
The Enterprise PostgreSQL Company
| From: | Nils Goroll <slink(at)schokola(dot)de> |
|---|---|
| To: | Jeff Janes <jeff(dot)janes(at)gmail(dot)com>, Robert Haas <robertmhaas(at)gmail(dot)com> |
| Cc: | Tom Lane <tgl(at)sss(dot)pgh(dot)pa(dot)us>, Martijn van Oosterhout <kleptog(at)svana(dot)org>, Merlin Moncure <mmoncure(at)gmail(dot)com>, pgsql-hackers(at)postgresql(dot)org |
| Subject: | Update on the spinlock->pthread_mutex patch experimental: replace s_lock spinlock code with pthread_mutex on linux |
| Date: | 2012-06-29 17:07:11 |
| Message-ID: | 4FEDE0BF.7080203@schokola.de |
| Views: | Raw Message | Whole Thread | Download mbox | Resend email |
| Lists: | pgsql-hackers |
Hi,
I'll reply to Jeff with a brief thank you to Robert the bottom.
First of all, here's an update:
I have slightly modified the patch, I'll attach what I have at the moment. The
main difference are
- loops around the pthread_mutex calls: As the locking function signature is to
return void at the moment, there is no error handling code in the callers
(so, theoretically, there should be a chance for an infinite loop on a
spinlock in the current code if you SIGKILL a spinlock holder (which you
shouldn't do, sure). Using robust mutexes, we could avoid this issue).
Retrying is probably the best we can do without implementing error recovery
in all callers.
- ereport(FATAL,"") instead of assertions, which is really what we should do
(imagine setting PTHREAD_PROCESS_SHARED fails and we still start up)
Some insights:
- I noticed that, for the simple pgbench tests I ran, PTHREAD_MUTEX_ADAPTIVE_NP
yielded worse results than PTHREAD_MUTEX_NORMAL, which is somehow counter-
intuitive, because _ADAPTIVE is closer to the current spinlock logic, but
yet syscalling in the first place seems to be more efficient than spinning
a little first and then syscalling (for the contended case).
The increase in usr/sys time for my tests was in the order of 10-20%.
- Also I noticed a general issue with linking to libpthread: My understanding is
that this should also change the code to be reentrant when compiling with
gcc (does anyone know precisely?), which we don't need - we only need the
locking code, unless we want to roll our own futex implementation (see below).
I am not sure if this is really root-caused because I have not fully
understood what is going on, but when compiling with LDFLAGS=-lpthread
for the top level Makefile, usr increses by some 10% for my tests.
The code is more efficient when I simply leave out -lpthread, libpthread
gets linked anyway.
- I had a look at futex sample code, for instance
http://locklessinc.com/articles/mutex_cv_futex/ and Ulrichs paper but I must say
at this point
I don't feel ready to roll own futex code for this most critical piece of
code. There is simply too much which can go wrong and major mistakes are very
hard to spot.
I'd very much prefer to use an existing, proven implementation.
At this point, I'd guess pulling in the relevant code from glibc/nptl
would be one of the safest bets, but even this path is risky.
On benchmarks:
With the same pgbench parameters as before, I ended up with comparable results
for unpatched and patched in terms of resource consumption:
Test setup for both:
for i in {1..10} ; do
rsync -av --delete /tmp/test_template_data/ /tmp/data/
/usr/bin/time ./postgres -D /tmp/data -p 55502 & ppid=$!
pid=$(pgrep -P $ppid)
sleep 15
./pgbench -c 256 -t 20 -j 128 -p 55502 postgres
kill $pid
wait $ppid
wait
while pgrep -f 55502 ; do
echo procs still running - hm
sleep 1
done
done
unpatched (bins postgresql-server-91-9.1.3-1PGDG.rhel6.rpm)
-bash-4.1$ grep elapsed /var/tmp/20120627_noslock_check/orig_code_2_perf
34.55user 20.07system 0:25.63elapsed 213%CPU (0avgtext+0avgdata 1360688maxresident)k
35.26user 19.90system 0:25.38elapsed 217%CPU (0avgtext+0avgdata 1360704maxresident)k
38.04user 21.68system 0:26.24elapsed 227%CPU (0avgtext+0avgdata 1360704maxresident)k
36.72user 21.95system 0:27.21elapsed 215%CPU (0avgtext+0avgdata 1360688maxresident)k
37.19user 22.00system 0:26.44elapsed 223%CPU (0avgtext+0avgdata 1360704maxresident)k
37.88user 22.58system 0:25.70elapsed 235%CPU (0avgtext+0avgdata 1360704maxresident)k
35.70user 20.90system 0:25.63elapsed 220%CPU (0avgtext+0avgdata 1360688maxresident)k
40.24user 21.65system 0:26.02elapsed 237%CPU (0avgtext+0avgdata 1360688maxresident)k
44.93user 22.96system 0:26.38elapsed 257%CPU (0avgtext+0avgdata 1360704maxresident)k
38.10user 21.51system 0:26.66elapsed 223%CPU (0avgtext+0avgdata 1360688maxresident)k
-bash-4.1$ grep elapsed /var/tmp/20120627_noslock_check/orig_code_2_perf | tail
-10 | sed 's:[^0-9. ]::g' | awk '{ u+=$1; s+=$2; c++;} END { print "avg " u/c "
" s/c; }'
avg 37.861 21.52
patched (based upon modified source rpm of the above)
-bash-4.1$ egrep elapsed
/var/tmp/20120627_noslock_check/with_slock_6_nocompile_without_top_-lpthread
42.32user 27.16system 0:28.18elapsed 246%CPU (0avgtext+0avgdata 2003488maxresident)k
39.14user 26.31system 0:27.24elapsed 240%CPU (0avgtext+0avgdata 2003504maxresident)k
38.81user 26.17system 0:26.67elapsed 243%CPU (0avgtext+0avgdata 2003520maxresident)k
41.04user 27.80system 0:29.00elapsed 237%CPU (0avgtext+0avgdata 2003520maxresident)k
35.41user 22.85system 0:27.15elapsed 214%CPU (0avgtext+0avgdata 2003504maxresident)k
32.74user 21.87system 0:25.62elapsed 213%CPU (0avgtext+0avgdata 2003504maxresident)k
35.68user 24.86system 0:27.16elapsed 222%CPU (0avgtext+0avgdata 2003520maxresident)k
32.10user 20.18system 0:27.26elapsed 191%CPU (0avgtext+0avgdata 2003504maxresident)k
31.32user 18.67system 0:26.95elapsed 185%CPU (0avgtext+0avgdata 2003488maxresident)k
29.99user 19.78system 0:32.08elapsed 155%CPU (0avgtext+0avgdata 2003504maxresident)k
-bash-4.1$ egrep elapsed
/var/tmp/20120627_noslock_check/with_slock_6_nocompile_without_top_-lpthread |
sed 's:[^0-9. ]::g' | awk '{ u+=$1; s+=$2; c++;} END { print "avg " u/c " " s/c; }'
avg 35.855 23.565
Hopefully I will get a chance to run this in production soon, unless I get
feedback from anyone with reasons why I shouldn't do this.
On 06/28/12 05:21 PM, Jeff Janes wrote:
> It looks like the hacked code is slower than the original. That
> doesn't seem so good to me. Am I misreading this?
No, you are right - in a way. This is not about maximizing tps, this is about
maximizing efficiency under load situations which I can't even simulate at the
moment. So What I am looking for are "comparable" resource consumption and
"comparable" tps - but no risk for concurrent spins on locks.
For minimal contention, using pthread_ functions _must_ be slightly slower than
the current s_lock spin code, but they _should_ scale *much* better at high
contention.
The tps values I got for the runs mentioned above are:
## original code
# egrep ^tps orig_code_2_perf | grep excl | tail -10 | tee /dev/tty | awk '{ a+=
$3; c++; } END { print a/c; }'
tps = 607.241375 (excluding connections establishing)
tps = 622.255763 (excluding connections establishing)
tps = 615.397928 (excluding connections establishing)
tps = 632.821217 (excluding connections establishing)
tps = 620.415654 (excluding connections establishing)
tps = 611.083542 (excluding connections establishing)
tps = 631.301615 (excluding connections establishing)
tps = 612.337597 (excluding connections establishing)
tps = 606.433209 (excluding connections establishing)
tps = 574.031095 (excluding connections establishing)
613.332
## patched code
# egrep ^tps with_slock_6_nocompile_without_top_-lpthread | grep excl | tail -10
| tee /dev/tty | awk '{ a+= $3; c++; } END { print a/c; }'
tps = 584.761390 (excluding connections establishing)
tps = 620.994437 (excluding connections establishing)
tps = 630.983695 (excluding connections establishing)
tps = 502.116770 (excluding connections establishing)
tps = 595.879789 (excluding connections establishing)
tps = 679.814563 (excluding connections establishing)
tps = 655.053339 (excluding connections establishing)
tps = 603.453768 (excluding connections establishing)
tps = 679.481280 (excluding connections establishing)
tps = 440.999884 (excluding connections establishing)
599.354
> Also, 20 transactions per connection is not enough of a run to make
> any evaluation on.
As you can see I've repeated the tests 10 times. I've tested slight variations
as mentioned above, so I was looking for quick results with acceptable variation.
> How many cores are you testing on?
64 x AMD64 1.6GHz (4x6262HE in one box)
>> Regarding the actual production issue, I did not manage to synthetically provoke
>> the saturation we are seeing in production using pgbench - I could not even get
>> anywhere near the production load.
>
> What metrics/tools are you using to compare the two loads?
We've got cpu + load avg statistics for the old+new machine and compared values
before/after the migration. The user load presumably is comparable and the main
metric is "users complaining" vs. "users happy".
I wish we had a synthetic benchmark close to the actual load, and I hope that
one of the insights from this will be that the customer should have one.
During what I believe is an overload situation with very high lock contention,
the load avg rises well above 300 and usr+sys well above 80%.
The temporary relief was to move some databases off to other machines.
Interestingly, moving away <10% of the load returned the system to a well
behaved state with usr+sys in the order of 20-30%, which is the main reason why
I believe that this must be a negative scalability issue for situations beyond
some saturation point determined by concurrency on locks.
> What is the production load like?
Here's an anonymized excerpt from a pgFouine analysis of 137 seconds worth of
query logs at "average production user load".
Type Count Percentage
SELECT 80,217 27.1
INSERT 6,248 2.1
UPDATE 37,159 12.6
DELETE 4,579 1.5
Queries that took up the most time (N) ^
Rank Total duration Times executed Av. duration s Query
1 3m39s 83,667 0.00 COMMIT;
2 54.4s 2 27.18 SELECT ...
3 41.1s 281 0.15 UPDATE ...
4 25.4s 18,960 0.00 UPDATE ...
5 21.9s ...
the 9th rank is already below 10 seconds Total duration
> Each transaction has to update one of ten pgbench_branch rows, so you
> can't have more than ten transactions productively active at any given
> time, even though you have 768 connections. So you need to jack up
> the pgbench scale, or switch to using -N mode.
Sorry for having omitted that detail. I had initialized pgbench with -i -s 100
> Also, you should use -M prepared, otherwise you spend more time
> parsing and planning the statements than executing them.
Ah, good point, thank you. As you will have noticed, I don't have years worth of
background with pgbench yet.
On 06/28/12 05:29 PM, Robert Haas wrote:
> FWIW, I kicked off a looong benchmarking run on this a couple of days
> ago on the IBM POWER7 box, testing pgbench -S, regular pgbench, and
> pgbench --unlogged-tables at various client counts with and without
> the patch; three half-hour test runs for each test configuration. It
> should be done tonight and I will post the results once they're in.
Sounds great! I am really curious.
Nils
| Attachment | Content-Type | Size |
|---|---|---|
| 0001-experimental-use-pthread-mutexes-instead-of-spinloc.patch | text/plain | 0 bytes |
| From: | Andres Freund <andres(at)2ndquadrant(dot)com> |
|---|---|
| To: | pgsql-hackers(at)postgresql(dot)org |
| Cc: | Nils Goroll <slink(at)schokola(dot)de>, Jeff Janes <jeff(dot)janes(at)gmail(dot)com>, Robert Haas <robertmhaas(at)gmail(dot)com>, Tom Lane <tgl(at)sss(dot)pgh(dot)pa(dot)us>, Martijn van Oosterhout <kleptog(at)svana(dot)org>, Merlin Moncure <mmoncure(at)gmail(dot)com> |
| Subject: | Re: Update on the spinlock->pthread_mutex patch experimental: replace s_lock spinlock code with pthread_mutex on linux |
| Date: | 2012-06-29 17:11:51 |
| Message-ID: | 201206291911.51506.andres@2ndquadrant.com |
| Views: | Raw Message | Whole Thread | Download mbox | Resend email |
| Lists: | pgsql-hackers |
On Friday, June 29, 2012 07:07:11 PM Nils Goroll wrote:
> > Also, 20 transactions per connection is not enough of a run to make
> > any evaluation on.
>
> As you can see I've repeated the tests 10 times. I've tested slight
> variations as mentioned above, so I was looking for quick results with
> acceptable variation.
Running only 20 transactions is still meaningless. Quite often that will means
that no backends run concurrently because the starting up takes longer than to
process those 20 transactions. You need at the very, very least 10s. Check out
-T.
Andres
--
Andres Freund http://www.2ndQuadrant.com/
PostgreSQL Development, 24x7 Support, Training & Services
| From: | Nils Goroll <slink(at)schokola(dot)de> |
|---|---|
| To: | Andres Freund <andres(at)2ndquadrant(dot)com> |
| Cc: | pgsql-hackers(at)postgresql(dot)org, Jeff Janes <jeff(dot)janes(at)gmail(dot)com>, Robert Haas <robertmhaas(at)gmail(dot)com>, Tom Lane <tgl(at)sss(dot)pgh(dot)pa(dot)us>, Martijn van Oosterhout <kleptog(at)svana(dot)org>, Merlin Moncure <mmoncure(at)gmail(dot)com> |
| Subject: | Re: Update on the spinlock->pthread_mutex patch experimental: replace s_lock spinlock code with pthread_mutex on linux |
| Date: | 2012-06-29 17:14:40 |
| Message-ID: | 4FEDE280.8080604@schokola.de |
| Views: | Raw Message | Whole Thread | Download mbox | Resend email |
| Lists: | pgsql-hackers |
> You need at the very, very least 10s.
ok, thanks.
| From: | Merlin Moncure <mmoncure(at)gmail(dot)com> |
|---|---|
| To: | Andres Freund <andres(at)2ndquadrant(dot)com> |
| Cc: | pgsql-hackers(at)postgresql(dot)org, Nils Goroll <slink(at)schokola(dot)de>, Jeff Janes <jeff(dot)janes(at)gmail(dot)com>, Robert Haas <robertmhaas(at)gmail(dot)com>, Tom Lane <tgl(at)sss(dot)pgh(dot)pa(dot)us>, Martijn van Oosterhout <kleptog(at)svana(dot)org> |
| Subject: | Re: Update on the spinlock->pthread_mutex patch experimental: replace s_lock spinlock code with pthread_mutex on linux |
| Date: | 2012-06-29 18:24:02 |
| Message-ID: | CAHyXU0zV9Hmwmmoq=4oOw5-Mdx1j8xyr+vJrqWPduanRVwxGEA@mail.gmail.com |
| Views: | Raw Message | Whole Thread | Download mbox | Resend email |
| Lists: | pgsql-hackers |
On Fri, Jun 29, 2012 at 12:11 PM, Andres Freund <andres(at)2ndquadrant(dot)com> wrote:
> On Friday, June 29, 2012 07:07:11 PM Nils Goroll wrote:
>> > Also, 20 transactions per connection is not enough of a run to make
>> > any evaluation on.
>>
>> As you can see I've repeated the tests 10 times. I've tested slight
>> variations as mentioned above, so I was looking for quick results with
>> acceptable variation.
> Running only 20 transactions is still meaningless. Quite often that will means
> that no backends run concurrently because the starting up takes longer than to
> process those 20 transactions. You need at the very, very least 10s. Check out
> -T.
yeah. also, standard pgbench is typically very much i/o bound on
typical hardware. it's would be much more interesting to see
performance in spinlock heavy workloads -- the OP noted one when
introducing the thread. would it be possible to simulate those
conditions.
merlin
| From: | Robert Haas <robertmhaas(at)gmail(dot)com> |
|---|---|
| To: | Nils Goroll <slink(at)schokola(dot)de> |
| Cc: | Jeff Janes <jeff(dot)janes(at)gmail(dot)com>, Tom Lane <tgl(at)sss(dot)pgh(dot)pa(dot)us>, Martijn van Oosterhout <kleptog(at)svana(dot)org>, Merlin Moncure <mmoncure(at)gmail(dot)com>, pgsql-hackers(at)postgresql(dot)org |
| Subject: | Re: Update on the spinlock->pthread_mutex patch experimental: replace s_lock spinlock code with pthread_mutex on linux |
| Date: | 2012-07-01 12:23:06 |
| Message-ID: | CA+TgmoYBmgT8t4koX_deKPFbn-xP3xXgL87T+ruUNTY9MNERfQ@mail.gmail.com |
| Views: | Raw Message | Whole Thread | Download mbox | Resend email |
| Lists: | pgsql-hackers |
On Fri, Jun 29, 2012 at 1:07 PM, Nils Goroll <slink(at)schokola(dot)de> wrote:
>> FWIW, I kicked off a looong benchmarking run on this a couple of days
>> ago on the IBM POWER7 box, testing pgbench -S, regular pgbench, and
>> pgbench --unlogged-tables at various client counts with and without
>> the patch; three half-hour test runs for each test configuration. It
>> should be done tonight and I will post the results once they're in.
>
> Sounds great! I am really curious.
Here are the results. Each result is the median of three 30-minute
test runs on an IBM POWER7 system with 16 cores, 64 hardware threads.
Configuration was shared_buffers = 8GB, maintenance_work_mem = 1GB,
synchronous_commit = off, checkpoint_segments = 300,
checkpoint_timeout = 15min, checkpoint_completion_target = 0.9,
wal_writer_delay = 20ms, log_line_prefix = '%t [%p] '. Lines
beginning with m show performance on master; lines beginning with p
show performance with patch; the following number is the # of clients
used for the test.
Permanent Tables
================
m01 tps = 1364.521373 (including connections establishing)
m08 tps = 9175.281381 (including connections establishing)
m32 tps = 14770.652793 (including connections establishing)
m64 tps = 14183.495875 (including connections establishing)
p01 tps = 1366.447001 (including connections establishing)
p08 tps = 9406.181857 (including connections establishing)
p32 tps = 14608.766540 (including connections establishing)
p64 tps = 14182.576636 (including connections establishing)
Unlogged Tables
===============
m01 tps = 1459.649000 (including connections establishing)
m08 tps = 11872.102025 (including connections establishing)
m32 tps = 32834.258026 (including connections establishing)
m64 tps = 33404.988834 (including connections establishing)
p01 tps = 1481.876584 (including connections establishing)
p08 tps = 11787.657258 (including connections establishing)
p32 tps = 32959.342248 (including connections establishing)
p64 tps = 33672.008244 (including connections establishing)
SELECT-only
===========
m01 tps = 8777.971832 (including connections establishing)
m08 tps = 70695.558964 (including connections establishing)
m32 tps = 201762.696020 (including connections establishing)
m64 tps = 310137.544470 (including connections establishing)
p01 tps = 8914.165586 (including connections establishing)
p08 tps = 71351.501358 (including connections establishing)
p32 tps = 201946.425301 (including connections establishing)
p64 tps = 305627.413716 (including connections establishing)
--
Robert Haas
EnterpriseDB: http://www.enterprisedb.com
The Enterprise PostgreSQL Company
| From: | Nils Goroll <slink(at)schokola(dot)de> |
|---|---|
| To: | Robert Haas <robertmhaas(at)gmail(dot)com> |
| Cc: | Jeff Janes <jeff(dot)janes(at)gmail(dot)com>, Tom Lane <tgl(at)sss(dot)pgh(dot)pa(dot)us>, Martijn van Oosterhout <kleptog(at)svana(dot)org>, Merlin Moncure <mmoncure(at)gmail(dot)com>, pgsql-hackers(at)postgresql(dot)org |
| Subject: | Re: Update on the spinlock->pthread_mutex patch experimental: replace s_lock spinlock code with pthread_mutex on linux |
| Date: | 2012-07-01 15:13:50 |
| Message-ID: | 4FF0692E.8080503@schokola.de |
| Views: | Raw Message | Whole Thread | Download mbox | Resend email |
| Lists: | pgsql-hackers |
Thank you, Robert.
as this patch was not targeted towards increasing tps, I am at happy to hear
that your benchmarks also suggest that performance is "comparable".
But my main question is: how about resource consumption? For the issue I am
working on, my current working hypothesis is that spinning on locks saturates
resources and brings down overall performance in a high-contention situation.
Do you have any getrusage figures or anything equivalent?
Thanks, Nils
| From: | Nils Goroll <slink(at)schokola(dot)de> |
|---|---|
| To: | Robert Haas <robertmhaas(at)gmail(dot)com> |
| Cc: | Jeff Janes <jeff(dot)janes(at)gmail(dot)com>, Tom Lane <tgl(at)sss(dot)pgh(dot)pa(dot)us>, Martijn van Oosterhout <kleptog(at)svana(dot)org>, Merlin Moncure <mmoncure(at)gmail(dot)com>, pgsql-hackers(at)postgresql(dot)org |
| Subject: | Re: Update on the spinlock->pthread_mutex patch experimental: replace s_lock spinlock code with pthread_mutex on linux |
| Date: | 2012-07-01 15:18:00 |
| Message-ID: | 4FF06A28.8050106@schokola.de |
| Views: | Raw Message | Whole Thread | Download mbox | Resend email |
| Lists: | pgsql-hackers |
> test runs on an IBM POWER7 system with 16 cores, 64 hardware threads.
Could you add the CPU Type / clock speed please?
| From: | Robert Haas <robertmhaas(at)gmail(dot)com> |
|---|---|
| To: | Nils Goroll <slink(at)schokola(dot)de> |
| Cc: | Jeff Janes <jeff(dot)janes(at)gmail(dot)com>, Tom Lane <tgl(at)sss(dot)pgh(dot)pa(dot)us>, Martijn van Oosterhout <kleptog(at)svana(dot)org>, Merlin Moncure <mmoncure(at)gmail(dot)com>, pgsql-hackers(at)postgresql(dot)org |
| Subject: | Re: Update on the spinlock->pthread_mutex patch experimental: replace s_lock spinlock code with pthread_mutex on linux |
| Date: | 2012-07-01 18:25:25 |
| Message-ID: | CA+TgmoZyp_8QoOXnbDWDSgDq0faLqV=MAHTnipYuWd-xJPoxJQ@mail.gmail.com |
| Views: | Raw Message | Whole Thread | Download mbox | Resend email |
| Lists: | pgsql-hackers |
On Sun, Jul 1, 2012 at 11:13 AM, Nils Goroll <slink(at)schokola(dot)de> wrote:
> as this patch was not targeted towards increasing tps, I am at happy to hear
> that your benchmarks also suggest that performance is "comparable".
>
> But my main question is: how about resource consumption? For the issue I am
> working on, my current working hypothesis is that spinning on locks saturates
> resources and brings down overall performance in a high-contention situation.
>
> Do you have any getrusage figures or anything equivalent?
Spinlock contentions cause tps to go down. The fact that tps didn't
change much in this case suggests that either these workloads don't
generate enough spinlock contention to benefit from your patch, or
your patch doesn't meaningfully reduce it, or both. We might need a
test case that is more spinlock-bound to observe an effect.
--
Robert Haas
EnterpriseDB: http://www.enterprisedb.com
The Enterprise PostgreSQL Company
| From: | Robert Haas <robertmhaas(at)gmail(dot)com> |
|---|---|
| To: | Nils Goroll <slink(at)schokola(dot)de> |
| Cc: | Jeff Janes <jeff(dot)janes(at)gmail(dot)com>, Tom Lane <tgl(at)sss(dot)pgh(dot)pa(dot)us>, Martijn van Oosterhout <kleptog(at)svana(dot)org>, Merlin Moncure <mmoncure(at)gmail(dot)com>, pgsql-hackers(at)postgresql(dot)org |
| Subject: | Re: Update on the spinlock->pthread_mutex patch experimental: replace s_lock spinlock code with pthread_mutex on linux |
| Date: | 2012-07-01 18:25:57 |
| Message-ID: | CA+Tgmob_VuTcg=hKj8qAL5314ERG1M80c_vwSSrCS44fh_NOJw@mail.gmail.com |
| Views: | Raw Message | Whole Thread | Download mbox | Resend email |
| Lists: | pgsql-hackers |
On Sun, Jul 1, 2012 at 11:18 AM, Nils Goroll <slink(at)schokola(dot)de> wrote:
>> test runs on an IBM POWER7 system with 16 cores, 64 hardware threads.
>
> Could you add the CPU Type / clock speed please?
cpu : POWER7 (architected), altivec supported
clock : 3550.000000MHz
revision : 2.1 (pvr 003f 0201)
--
Robert Haas
EnterpriseDB: http://www.enterprisedb.com
The Enterprise PostgreSQL Company
| From: | Nils Goroll <slink(at)schokola(dot)de> |
|---|---|
| To: | Robert Haas <robertmhaas(at)gmail(dot)com> |
| Cc: | Jeff Janes <jeff(dot)janes(at)gmail(dot)com>, Tom Lane <tgl(at)sss(dot)pgh(dot)pa(dot)us>, Martijn van Oosterhout <kleptog(at)svana(dot)org>, Merlin Moncure <mmoncure(at)gmail(dot)com>, pgsql-hackers(at)postgresql(dot)org |
| Subject: | Re: Update on the spinlock->pthread_mutex patch experimental: replace s_lock spinlock code with pthread_mutex on linux |
| Date: | 2012-07-01 19:02:05 |
| Message-ID: | 4FF09EAD.6080902@schokola.de |
| Views: | Raw Message | Whole Thread | Download mbox | Resend email |
| Lists: | pgsql-hackers |
Hi Robert,
> Spinlock contentions cause tps to go down. The fact that tps didn't
> change much in this case suggests that either these workloads don't
> generate enough spinlock contention to benefit from your patch, or
> your patch doesn't meaningfully reduce it, or both. We might need a
> test case that is more spinlock-bound to observe an effect.
Agree. My understanding is that
- for no contention, aquiring a futex should almost be as fast as aquiring a
spinlock, so we should observe
- comparable tps
- comparable resource consumption
I believe this is what your test has shown for the low concurrency tests.
- for light contention, spinning will be faster than syscalling, so
we should observe with the patch
- slightly worse tps
- more syscalls, otherwise comparable resource consumption
I believe your test supports the first point for high concurrency tests.
- for high contention, spinning should be be
- unfair (because the time to aquire a lock is not deterministic -
individual threads could starve)
- much less efficient
and we should see with the patch
- slightly better tps if the system is not saturated because
the next process to aquire a contended futex gets scheduled immediately,
rather than when a process returns from sleeping
- much better tps if the system is saturated / oversubscribed due to
increased scheduling latency for spinning processes
- significantly lower resource consumption
- so we should have much more headroom before running into saturation
as described above
So would it be possible for you to record resource consumption and rerun the test?
Thank you, Nils
| From: | Jeff Janes <jeff(dot)janes(at)gmail(dot)com> |
|---|---|
| To: | Nils Goroll <slink(at)schokola(dot)de> |
| Cc: | Robert Haas <robertmhaas(at)gmail(dot)com>, Tom Lane <tgl(at)sss(dot)pgh(dot)pa(dot)us>, Martijn van Oosterhout <kleptog(at)svana(dot)org>, Merlin Moncure <mmoncure(at)gmail(dot)com>, pgsql-hackers(at)postgresql(dot)org |
| Subject: | Re: Update on the spinlock->pthread_mutex patch experimental: replace s_lock spinlock code with pthread_mutex on linux |
| Date: | 2012-07-01 20:25:27 |
| Message-ID: | CAMkU=1w5VcGtv=xV-9hnhFn0MsH3hHcasR4bnWCxz-JSonFwKw@mail.gmail.com |
| Views: | Raw Message | Whole Thread | Download mbox | Resend email |
| Lists: | pgsql-hackers |
On Fri, Jun 29, 2012 at 10:07 AM, Nils Goroll <slink(at)schokola(dot)de> wrote:
> On 06/28/12 05:21 PM, Jeff Janes wrote:
>
>> It looks like the hacked code is slower than the original. That
>> doesn't seem so good to me. Am I misreading this?
>
> No, you are right - in a way. This is not about maximizing tps, this is about
> maximizing efficiency under load situations
But why wouldn't this maximized efficiency present itself as increased TPS?
>
>> Also, 20 transactions per connection is not enough of a run to make
>> any evaluation on.
>
> As you can see I've repeated the tests 10 times. I've tested slight variations
> as mentioned above, so I was looking for quick results with acceptable variation.
Testing it 10 times doesn't necessarily improve things. You have ten
times as many transactions, but you also have 10 times as much
start-up and tear-down events polluting the numbers. (Unless this
start up and tear down are exactly the things you are trying to
measure). And once you change your benchmark so that it is testing
what you want to be testing, it will probably get even worse. You
should use at least -T30, rather than -t20.
Anyway, your current benchmark speed of around 600 TPS over such a
short time periods suggests you are limited by fsyncs. It is going to
be pretty hard to get a spinlock bottleneck in simple queries like
pgbench does as long as that is the case. You could turn --fsync=off,
or just change your benchmark to a read-only one like -S, or better
the -P option I've been trying get into pgbench.
Does your production server have fast fsyncs (BBU) while your test
server does not?
>
>>> Regarding the actual production issue, I did not manage to synthetically provoke
>>> the saturation we are seeing in production using pgbench - I could not even get
>>> anywhere near the production load.
>>
>> What metrics/tools are you using to compare the two loads?
>
> We've got cpu + load avg statistics for the old+new machine and compared values
> before/after the migration. The user load presumably is comparable and the main
> metric is "users complaining" vs. "users happy".
The users probably don't care about the load average. Presumably they
are unhappy because of lowered throughput (TPS) or higher peak latency
(-l switch in pgbench). So I think the only use of load average is to
verify that your benchmark is nothing like your production workload.
(But it doesn't go the other way around, just because the load
averages are similar doesn't mean the actual workloads are.)
> I wish we had a synthetic benchmark close to the actual load, and I hope that
> one of the insights from this will be that the customer should have one.
If they could simulate a workload close to what they actually do, that
would be great. But surely just with fairly simple pgbench
configuration you can get much closer to it than what you are
currently.
>> What is the production load like?
>
> Here's an anonymized excerpt from a pgFouine analysis of 137 seconds worth of
> query logs at "average production user load".
>
> Type Count Percentage
> SELECT 80,217 27.1
> INSERT 6,248 2.1
> UPDATE 37,159 12.6
> DELETE 4,579 1.5
Without knowing how complicated the joins involved in the various
statements are, I don't think I can get much info out of this. but
I'm not familiar with pgFouine, maybe there is another way to
summarize its output that is more informative.
>
> Queries that took up the most time (N) ^
>
>
> Rank Total duration Times executed Av. duration s Query
> 1 3m39s 83,667 0.00 COMMIT;
So fsync's probably are not totally free on production, but I still
think they must be much cheaper than on your test box.
> 2 54.4s 2 27.18 SELECT ...
That is interesting. Maybe those two queries are hammering everything
else to death.
> 3 41.1s 281 0.15 UPDATE ...
> 4 25.4s 18,960 0.00 UPDATE ...
> 5 21.9s ...
>
> the 9th rank is already below 10 seconds Total duration
But how does the 9th rank through the final rank, cumulatively, stack up?
In other words, how many query-seconds worth of time transpired during
the 137 wall seconds? That would give an estimate of how many
simultaneously active connections the production server has.
>> Each transaction has to update one of ten pgbench_branch rows, so you
>> can't have more than ten transactions productively active at any given
>> time, even though you have 768 connections. So you need to jack up
>> the pgbench scale, or switch to using -N mode.
>
> Sorry for having omitted that detail. I had initialized pgbench with -i -s 100
Are you sure? In an earlier email you reported the entire output of
pgbench, and is said it was using 10. Maybe you've changed it since
then...
Cheers,
Jeff
| From: | Nils Goroll <slink(at)schokola(dot)de> |
|---|---|
| To: | Jeff Janes <jeff(dot)janes(at)gmail(dot)com> |
| Cc: | Robert Haas <robertmhaas(at)gmail(dot)com>, Tom Lane <tgl(at)sss(dot)pgh(dot)pa(dot)us>, Martijn van Oosterhout <kleptog(at)svana(dot)org>, Merlin Moncure <mmoncure(at)gmail(dot)com>, pgsql-hackers(at)postgresql(dot)org |
| Subject: | Re: Update on the spinlock->pthread_mutex patch experimental: replace s_lock spinlock code with pthread_mutex on linux |
| Date: | 2012-07-01 21:28:30 |
| Message-ID: | 4FF0C0FE.3010608@schokola.de |
| Views: | Raw Message | Whole Thread | Download mbox | Resend email |
| Lists: | pgsql-hackers |
Hi Jeff,
>>> It looks like the hacked code is slower than the original. That
>>> doesn't seem so good to me. Am I misreading this?
>>
>> No, you are right - in a way. This is not about maximizing tps, this is about
>> maximizing efficiency under load situations
>
> But why wouldn't this maximized efficiency present itself as increased TPS?
Because the latency of lock aquision influences TPS, but this is only marginally
related to the cost in terms of cpu cyclues to aquire the locks.
See my posting as of Sun, 01 Jul 2012 21:02:05 +0200 for an overview of my
understanding.
>>> Also, 20 transactions per connection is not enough of a run to make
>>> any evaluation on.
>>
>> As you can see I've repeated the tests 10 times. I've tested slight variations
>> as mentioned above, so I was looking for quick results with acceptable variation.
>
> Testing it 10 times doesn't necessarily improve things.
My intention was to average over the imperfections of rusage accounting because
I was maily interested in lowering rusage, not maximizing tps.
Yes, in order to get reliable results, I'd have to run longer tests, but
interestingly the results from my quick tests already approximated those from
the huge tests Robert has run with respect to the differences between unpatched
and patched.
> You should use at least -T30, rather than -t20.
Thanks for the advice - it is really appreciated and I will take it when I run
more test tests.
But I don't understand yet how to best provoke high spinlock concurrency with
pgbench. Or are there are any other test tools out there for this case?
> Anyway, your current benchmark speed of around 600 TPS over such a
> short time periods suggests you are limited by fsyncs.
Definitely. I described the setup in my initial posting ("why roll-your-own
s_lock? / improving scalability" - Tue, 26 Jun 2012 19:02:31 +0200)
> pgbench does as long as that is the case. You could turn --fsync=off,
> or just change your benchmark to a read-only one like -S, or better
> the -P option I've been trying get into pgbench.
I don't like to make assumptions which I haven't validated. The system showing
the behavior is designed to write to persistent SSD storage in order to reduce
the risk of data loss by a (BBU) cache failure. Running a test with fsync=off
would divert even further from reality.
> Does your production server have fast fsyncs (BBU) while your test
> server does not?
No, we're writing directly to SSDs (ref: initial posting).
> The users probably don't care about the load average. Presumably they
> are unhappy because of lowered throughput (TPS) or higher peak latency
> (-l switch in pgbench). So I think the only use of load average is to
> verify that your benchmark is nothing like your production workload.
> (But it doesn't go the other way around, just because the load
> averages are similar doesn't mean the actual workloads are.)
Fully agree.
>> Rank Total duration Times executed Av. duration s Query
>> 1 3m39s 83,667 0.00 COMMIT;
>
> So fsync's probably are not totally free on production, but I still
> think they must be much cheaper than on your test box.
Oh, the two are the same. I ran the tests on the prod machine during quiet periods.
>> 2 54.4s 2 27.18 SELECT ...
>
> That is interesting. Maybe those two queries are hammering everything
> else to death.
With 64 cores?
I should have mentioned that these were simply the result of a missing index
when the data was collected.
> But how does the 9th rank through the final rank, cumulatively, stack up?
>
> In other words, how many query-seconds worth of time transpired during
> the 137 wall seconds? That would give an estimate of how many
> simultaneously active connections the production server has.
Sorry, I should have given you the stats from pgFouine:
Number of unique normalized queries: 507
Number of queries: 295,949
Total query duration: 8m38s
First query: 2012-06-23 14:51:01
Last query: 2012-06-23 14:53:17
Query peak: 6,532 queries/s at 2012-06-23 14:51:33
>> Sorry for having omitted that detail. I had initialized pgbench with -i -s 100
>
> Are you sure? In an earlier email you reported the entire output of
> pgbench, and is said it was using 10. Maybe you've changed it since
> then...
good catch, I was wrong in the email you quoted. Sorry.
-bash-4.1$ rsync -av --delete /tmp/test_template_data/ /tmp/data/
...
-bash-4.1$ ./postgres -D /tmp/data -p 55502 &
[1] 38303
-bash-4.1$ LOG: database system was shut down at 2012-06-26 23:18:42 CEST
LOG: database system is ready to accept connections
LOG: autovacuum launcher started
-bash-4.1$ ./psql -p 55502
psql (9.1.3)
Type "help" for help.
postgres=# select count(*) from pgbench_branches;
count
-------
10
(1 row)
Thank you very much, Jeff! The one question remains: Do we really have all we
need to provoke very high lock contention?
Nils
| From: | Jeff Janes <jeff(dot)janes(at)gmail(dot)com> |
|---|---|
| To: | Nils Goroll <slink(at)schokola(dot)de> |
| Cc: | Robert Haas <robertmhaas(at)gmail(dot)com>, Tom Lane <tgl(at)sss(dot)pgh(dot)pa(dot)us>, Martijn van Oosterhout <kleptog(at)svana(dot)org>, Merlin Moncure <mmoncure(at)gmail(dot)com>, pgsql-hackers(at)postgresql(dot)org |
| Subject: | Re: Update on the spinlock->pthread_mutex patch experimental: replace s_lock spinlock code with pthread_mutex on linux |
| Date: | 2012-07-01 23:07:02 |
| Message-ID: | CAMkU=1wJpgDz4Zj0+N+ZFX4B2q5aPULiaTMgeNbaadpafmKtqA@mail.gmail.com |
| Views: | Raw Message | Whole Thread | Download mbox | Resend email |
| Lists: | pgsql-hackers |
On Sun, Jul 1, 2012 at 2:28 PM, Nils Goroll <slink(at)schokola(dot)de> wrote:
> Hi Jeff,
>
>>>> It looks like the hacked code is slower than the original. That
>>>> doesn't seem so good to me. Am I misreading this?
>>>
>>> No, you are right - in a way. This is not about maximizing tps, this is about
>>> maximizing efficiency under load situations
>>
>> But why wouldn't this maximized efficiency present itself as increased TPS?
>
> Because the latency of lock aquision influences TPS, but this is only marginally
> related to the cost in terms of cpu cyclues to aquire the locks.
>
> See my posting as of Sun, 01 Jul 2012 21:02:05 +0200 for an overview of my
> understanding.
I still don't see how improving that could not improve TPS. But let's
focus on reproducing the problem first, otherwise it is all just
talking in the dark.
> But I don't understand yet how to best provoke high spinlock concurrency with
> pgbench. Or are there are any other test tools out there for this case?
Use pgbench -S, or apply my patch from "pgbench--new transaction type"
and then run pgbench -P.
Make sure that the scale is such that all of your data fits in
shared_buffers (I find on 64 bit that pgbench takes about 15MB *
scale)
>> Anyway, your current benchmark speed of around 600 TPS over such a
>> short time periods suggests you are limited by fsyncs.
>
> Definitely. I described the setup in my initial posting ("why roll-your-own
> s_lock? / improving scalability" - Tue, 26 Jun 2012 19:02:31 +0200)
OK. It looks like several things changed simultaneously. How likely
do you think it is that the turning off of the write cache caused the
problem?
>
>> pgbench does as long as that is the case. You could turn --fsync=off,
>> or just change your benchmark to a read-only one like -S, or better
>> the -P option I've been trying get into pgbench.
>
> I don't like to make assumptions which I haven't validated. The system showing
> the behavior is designed to write to persistent SSD storage in order to reduce
> the risk of data loss by a (BBU) cache failure. Running a test with fsync=off
> would divert even further from reality.
I think that you can't get much farther from reality than your current
benchmarks are, I'm afraid.
If your goal is the get pgbench closer to being limited by spinlock
contention, then fsync=off, or using -S or -P, will certainly do that.
So if you have high confidence that spinlock contention is really the
problem, fsync=off will get you closer to the thing you want to focus
on, even if it takes you further away from the holistic big-picture
production environment. And since you went to the trouble of making
patches for spinlocks, I assume you are fairly confident that that is
the problem.
If you are not confident that spinlocks are really the problem, then I
agree it would be a mistake to try to craft a simple pgbench run which
focuses in on one tiny area which might not actually be the correct
area. In that case, you would instead want to either create a very
complicated workload that closely simulates your production load (a
huge undertaking) or find a way to capture an oprofile of the
production server while it is actually in distress. Also, it would
help if you could get oprofile to do a call graph so you can see which
call sites the contended spin locks are coming from (sorry, I don't
know how to do this successfully with oprofile)
>
>> Does your production server have fast fsyncs (BBU) while your test
>> server does not?
>
> No, we're writing directly to SSDs (ref: initial posting).
OK. So it seems like the pgbench workload you are doing are limited
by fsyncs, and the CPU is basically idle because of that limit. While
your real work load needs a much larger amount of processing power per
fsync, so it is closer to both limits at the same time. But, since
the stats you posted were for the normal rather than the distressed
state, maybe I'm way off here.
Anyway, the easiest way to increase the pgbench "CPU per fsync" need
is to turn of fsync or synchronous_commit, or to switch to read only
queries.
>>> 2 54.4s 2 27.18 SELECT ...
>>
>> That is interesting. Maybe those two queries are hammering everything
>> else to death.
>
> With 64 cores?
Maybe. That is the nature of spin-locks. The more cores you have,
the more other things each one interferes with. Except that the
duration is not long enough to cover the entire run period. But then
again, maybe in the distressed state those same queries did cover the
entire duration. But yeah, now that I think about it this would not
be my top hypothesis.
>>
>> In other words, how many query-seconds worth of time transpired during
>> the 137 wall seconds? That would give an estimate of how many
>> simultaneously active connections the production server has.
>
> Sorry, I should have given you the stats from pgFouine:
>
> Number of unique normalized queries: 507
> Number of queries: 295,949
> Total query duration: 8m38s
> First query: 2012-06-23 14:51:01
> Last query: 2012-06-23 14:53:17
> Query peak: 6,532 queries/s at 2012-06-23 14:51:33
A total duration of 518 seconds over 136 seconds of wall time suggests
there is not all that much concurrent activity going on. But maybe
time spent in commit is not counted by pgFouine? But again, these
stats are for the normal state, not the distressed state.
> Thank you very much, Jeff! The one question remains: Do we really have all we
> need to provoke very high lock contention?
I think you do. (I don't have 64 cores...)
Lots of cores, running pgbench -c64 -j64 -P -T60 on a scale that fits
in shared_buffers.
Cheers,
Jeff
| From: | Nils Goroll <slink(at)schokola(dot)de> |
|---|---|
| To: | Jeff Janes <jeff(dot)janes(at)gmail(dot)com> |
| Cc: | Robert Haas <robertmhaas(at)gmail(dot)com>, Tom Lane <tgl(at)sss(dot)pgh(dot)pa(dot)us>, Martijn van Oosterhout <kleptog(at)svana(dot)org>, Merlin Moncure <mmoncure(at)gmail(dot)com>, pgsql-hackers(at)postgresql(dot)org |
| Subject: | Re: Update on the spinlock->pthread_mutex patch experimental: replace s_lock spinlock code with pthread_mutex on linux |
| Date: | 2012-07-02 08:22:42 |
| Message-ID: | 4FF15A52.6050807@schokola.de |
| Views: | Raw Message | Whole Thread | Download mbox | Resend email |
| Lists: | pgsql-hackers |
Jeff,
without further ado: Thank you, I will go away, run pgbench according to your
advice and report back.
Nils
| From: | Nils Goroll <slink(at)schokola(dot)de> |
|---|---|
| To: | Jeff Janes <jeff(dot)janes(at)gmail(dot)com> |
| Cc: | Robert Haas <robertmhaas(at)gmail(dot)com>, Tom Lane <tgl(at)sss(dot)pgh(dot)pa(dot)us>, Martijn van Oosterhout <kleptog(at)svana(dot)org>, Merlin Moncure <mmoncure(at)gmail(dot)com>, pgsql-hackers(at)postgresql(dot)org |
| Subject: | Re: Update on the spinlock->pthread_mutex patch experimental: replace s_lock spinlock code with pthread_mutex on linux |
| Date: | 2012-07-02 13:02:48 |
| Message-ID: | 4FF19BF8.1020203@schokola.de |
| Views: | Raw Message | Whole Thread | Download mbox | Resend email |
| Lists: | pgsql-hackers |
just a quick note: I got really interesting results, but the writeup is not done
yet. Will get back to this ASAP.
| From: | Nils Goroll <slink(at)schokola(dot)de> |
|---|---|
| To: | Jeff Janes <jeff(dot)janes(at)gmail(dot)com> |
| Cc: | Robert Haas <robertmhaas(at)gmail(dot)com>, Tom Lane <tgl(at)sss(dot)pgh(dot)pa(dot)us>, Martijn van Oosterhout <kleptog(at)svana(dot)org>, Merlin Moncure <mmoncure(at)gmail(dot)com>, pgsql-hackers(at)postgresql(dot)org |
| Subject: | spinlock->pthread_mutex : first results with Jeff's pgbench+plsql |
| Date: | 2012-07-02 15:26:05 |
| Message-ID: | 4FF1BD8D.9050003@schokola.de |
| Views: | Raw Message | Whole Thread | Download mbox | Resend email |
| Lists: | pgsql-hackers |
Hi Jeff and all,
apparently, Jeff has indeed been very right on how to provoke spinlock
contention with his patched pgbench.
The following table (view attached pdf if you can) summarizes the results of the
pgbench runs detailed at the bottom of this mail. For some pgbench
configurations, I have tested the original against the patched code:
- 8/16/32/64/128 threads with one pgbench database
- 2x128 threads to each of two pgbench databases
The colums are:
tr: sum of "number of transactions actually processed" output from
pgbench
sps_ex sum of "selects per second (excluding connections
establishing)" from pgbench
u: usr time as reported by /usr/bin/time
s: sys time as reported by /usr/bin/time
(u+s)/tr resource consumption normalized by the number of
transactions processed
The p/o row gives the patched-to-unpatched ratio of the respective column in percent
TEST tr sps_ex u s (u+s)/tr
8 threads 1 DB
o 1080 178,768.20 461.65 43.40 0.47
p 328 53,967.07 345.73 132.51 1.46
p/o 30.19% 74.89% 305.32% 311.79%
16 threads 1 DB
o 764 124,476.93 899.84 103.89 1.31
p 178 29,142.80 402.85 333.87 4.14
p/o 23.41% 44.77% 321.37% 315.04%
32 threads 1 DB
o 228 36,434.82 1,647.15 175.14 7.99
p 190 27,193.83 428.31 585.52 5.34
p/o 74.64% 26.00% 334.32% 66.76%
64 threads 1 DB
o 195 29,724.96 2,268.39 439.51 13.89
p 192 24,127.50 458.46 886.33 7.00
p/o 81.17% 20.21% 201.66% 50.44%
128 threads 1 DB
o 128 16,638.27 2,780.02 322.67 24.24
p 256 22,756.89 592.34 1,114.39 6.67
p/o 136.77% 21.31% 345.37% 27.50%
128 threads 2 DBs
o 256 10,444.96 9,050.27 523.88 37.40
p 256 21,265.00 667.79 1,052.84 6.72
p/o 203.59% 7.38% 200.97% 17.97%
How I read this under the assumption that the test was correct and valid _and_
can be reproduced independently:
* for very low concurrency, the existing spinlock implementation is ideal -
we can't do any better both in terms of resulting sps and resource
consumption.
One path to explore here would be PTHREAD_MUTEX_ADAPTIVE_NP, which essentially
is the same as a spinlock for contended case with very low lock aquisition
time. The code which I have tested uses PTHREAD_MUTEX_NORMAL, which, on Linux,
will always syscall for the contended case.
Quite clearly the overhead is with futexes syscalling, because kernel
resource consumption is 3x higher with the patch than without.
* With this benchmark, for "half" concurrency in the order of 0.5 x #cores,
spinlocks still yield better tps, but resource overhead for spinlocks starts
to take off and futexes are already 40% more efficient, despite the fact that
spinlocks still have a 25% advantage in terms of sps.
* At "full" concurrency (64 threads on 64 cores), resource consumption of
the spinlocks leads to almost doubled overall resource consumption and
the increased efficiency starts to pay off in terms of sps
* and for the "quadruple overloaded" case (2x128 threads on 64 cores), spinlock
contention really brings the system down and sps drops to half.
Please note that this is with 3.1.7. I understand that many scalability
improvements have been implemented in later versions and it would have to be
expected that using less synchronization points will imply that spinlock
overhead is less. In other words, the results _should_ look less drastic with
later versions.
Please do also take note of the custom minimum time quantum scheduler
parameters, which could have a significant impact on the result (and I have not
yet repeated this benchmark with the defaults). Regarding the actual production
issue, though, I had started with default parameters and only changed them
later. The adjusted values appeared to have positive effects.
Having said this, I take the benchmark results as a clear indication that
postgresql scalability issues at least in 9.1 are highly related to spinlock
contention on large systems.
My personal opinion is that a system which behaves in a stable and predictable
manner also in high load situations should be preferred over one which has
optimal results for the best case, but I could imagine that with a custom futex
implementation we could have a more adaptive approach and maybe even get the
benefits without much of the drawbacks. Maybe one could have stats on individual
spinlocks and adjust the amount of "adaptive spinning" before deciding to syscall?
A simpler approach could be a global config variable for the type of lock to use
for traditional spinlocks. At this point, I could imagine:
- traditional s_lock
- PTHREAD_MUTEX_ADAPTIVE_NP
- PTHREAD_MUTEX_NORMAL
== SETUP DETAILS ==
=== Initialization ===
cd /usr/pgsql-9.1noslock/bin
./initdb -D /var/tmp/data_jeff_bench
for i in {1..6} ; do \
echo "create database bench_scale100_$i;" ; done \
| ./psql -p 55432 postgres
for i in {1..6} ; do \
./pgbench -p 55432 -i -s 100 bench_scale100_$i &
done
# stop postgres
mv /var/tmp/data_jeff_bench /var/tmp/data_jeff_bench_template
=== pgsql config ===
$ egrep '^[a-z]' /var/tmp/data_jeff_bench_template/postgresql.conf
max_connections = 1800 # (change requires restart)
shared_buffers = 10GB # min 128kB
temp_buffers = 64MB # min 800kB
work_mem = 256MB # min 64kB,d efault 1MB
maintenance_work_mem = 2GB # min 1MB, default 16MB
bgwriter_delay = 10ms # 10-10000ms between rounds
bgwriter_lru_maxpages = 1000 # 0-1000 max buffers written/round
bgwriter_lru_multiplier = 10.0 # 0-10.0 multipler on buffers scanned/round
wal_level = hot_standby # minimal, archive, or hot_standby
wal_buffers = 64MB # min 32kB, -1 sets based on shared_buffers
fsync = off # turns forced synchronization on or off
commit_delay = 10000 # range 0-100000, in microseconds
datestyle = 'iso, mdy'
lc_messages = 'en_US.UTF-8' # locale for system error message
lc_monetary = 'en_US.UTF-8' # locale for monetary formatting
lc_numeric = 'en_US.UTF-8' # locale for number formatting
lc_time = 'en_US.UTF-8' # locale for time formatting
default_text_search_config = 'pg_catalog.english'
seq_page_cost = 1.0 # measured on an arbitrary scale
random_page_cost = 1.5 # same scale as above (default: 4.0)
cpu_tuple_cost = 0.005
cpu_index_tuple_cost = 0.0025
cpu_operator_cost = 0.0001
effective_cache_size = 192GB
== RUN DETAILS ==
used attached "bench.sh"
the pwd output indicates the postgresql server binaries used
original binaries are
running all processes with nice 19
scheduler settings:
# s ms us ns
kernel.sched_min_granularity_ns = 100000000
kernel.sched_wakeup_granularity_ns = 100000000
kernel.sched_latency_ns = 1000000000
# can migrate to all CPUs
kernel.sched_nr_migrate = 64
=== 8 threads 1 DB original code ===
++ pwd
/usr/pgsql-9.1/bin
++ ppid=6955
++ /usr/bin/time ./postgres -D /mnt/db1/ssd/tables/.t/data_jeff_bench/ -p 55432
+++ pgrep -P 6955
++ pid=6957
++ sleep 15
LOG: database system was shut down at 2012-07-02 11:30:16 CEST
LOG: database system is ready to accept connections
LOG: autovacuum launcher started
++ /usr/pgsql-9.1noslock/bin/pgbench -c8 -j8 -P -T60 -s100 -p 55432 bench_scale100_1
Scale option ignored, using pgbench_branches table count = 100
plgsql function created.
starting vacuum...end.
transaction type: SELECT only via plpgsql
scaling factor: 100
query mode: simple
number of clients: 8
number of threads: 8
duration: 60 s
number of transactions actually processed: 1080
tps = 17.869689 (including connections establishing)
tps = 17.876820 (excluding connections establishing)
selects per second = 178696.891635 (including connections establishing)
selects per second = 178768.198473 (excluding connections establishing)
++ kill 6957
++ wait
LOG: received smart shutdown request
LOG: autovacuum launcher shutting down
LOG: shutting down
LOG: database system is shut down
461.65user 43.40system 1:19.95elapsed 631%CPU (0avgtext+0avgdata
6326144maxresident)k
0inputs+4248outputs (0major+3287417minor)pagefaults 0swaps
=== 8 threads 1 DB patched ===
++ pwd
/usr/pgsql-9.1noslock/bin
++ ppid=10346
++ /usr/bin/time ./postgres -D /mnt/db1/ssd/tables/.t/data_jeff_bench/ -p 55432
+++ pgrep -P 10346
++ pid=10348
++ sleep 15
LOG: database system was shut down at 2012-07-02 11:30:16 CEST
LOG: autovacuum launcher started
LOG: database system is ready to accept connections
++ /usr/pgsql-9.1noslock/bin/pgbench -c8 -j8 -P -T60 -s100 -p 55432 bench_scale100_1
Scale option ignored, using pgbench_branches table count = 100
plgsql function created.
starting vacuum...end.
transaction type: SELECT only via plpgsql
scaling factor: 100
query mode: simple
number of clients: 8
number of threads: 8
duration: 60 s
number of transactions actually processed: 328
tps = 5.394723 (including connections establishing)
tps = 5.396707 (excluding connections establishing)
selects per second = 53947.230891 (including connections establishing)
selects per second = 53967.065956 (excluding connections establishing)
++ kill 10348
++ wait
LOG: received smart shutdown request
LOG: autovacuum launcher shutting down
LOG: shutting down
LOG: database system is shut down
345.73user 132.51system 1:21.42elapsed 587%CPU (0avgtext+0avgdata
5798640maxresident)k
0inputs+4240outputs (0major+3051296minor)pagefaults 0swaps
=== 16 threads 1 DB original code ===
++ pwd
/usr/pgsql-9.1/bin
++ ppid=54955
++ /usr/bin/time ./postgres -D /mnt/db1/ssd/tables/.t/data_jeff_bench/ -p 55432
+++ pgrep -P 54955
++ pid=54957
++ sleep 15
LOG: database system was shut down at 2012-07-02 11:30:16 CEST
LOG: database system is ready to accept connections
LOG: autovacuum launcher started
++ /usr/pgsql-9.1noslock/bin/pgbench -c16 -j16 -P -T60 -s100 -p 55432
bench_scale100_1
Scale option ignored, using pgbench_branches table count = 100
plgsql function created.
starting vacuum...end.
transaction type: SELECT only via plpgsql
scaling factor: 100
query mode: simple
number of clients: 16
number of threads: 16
duration: 60 s
number of transactions actually processed: 764
tps = 12.441953 (including connections establishing)
tps = 12.447693 (excluding connections establishing)
selects per second = 124419.525508 (including connections establishing)
selects per second = 124476.932381 (excluding connections establishing)
++ kill 54957
++ wait
LOG: received smart shutdown request
LOG: autovacuum launcher shutting down
LOG: shutting down
LOG: database system is shut down
899.84user 103.89system 1:22.65elapsed 1214%CPU (0avgtext+0avgdata
6040912maxresident)k
0inputs+4224outputs (0major+5718494minor)pagefaults 0swaps
=== 16 threads 1 DB patched ===
++ pwd
/usr/pgsql-9.1noslock/bin
++ ppid=57669
++ /usr/bin/time ./postgres -D /mnt/db1/ssd/tables/.t/data_jeff_bench/ -p 55432
+++ pgrep -P 57669
++ pid=57671
++ sleep 15
LOG: database system was shut down at 2012-07-02 11:30:16 CEST
LOG: database system is ready to accept connections
LOG: autovacuum launcher started
++ /usr/pgsql-9.1noslock/bin/pgbench -c16 -j16 -P -T60 -s100 -p 55432
bench_scale100_1
Scale option ignored, using pgbench_branches table count = 100
plgsql function created.
starting vacuum...end.
transaction type: SELECT only via plpgsql
scaling factor: 100
query mode: simple
number of clients: 16
number of threads: 16
duration: 60 s
number of transactions actually processed: 178
tps = 2.912747 (including connections establishing)
tps = 2.914280 (excluding connections establishing)
selects per second = 29127.471536 (including connections establishing)
selects per second = 29142.795859 (excluding connections establishing)
++ kill 57671
++ wait
LOG: received smart shutdown request
LOG: autovacuum launcher shutting down
LOG: shutting down
LOG: database system is shut down
402.85user 333.87system 1:19.92elapsed 921%CPU (0avgtext+0avgdata
3896960maxresident)k
0inputs+4248outputs (0major+3968573minor)pagefaults 0swaps
=== 32 threads 1 DB original code ===
++ pwd
/usr/pgsql-9.1/bin
++ ppid=61921
++ /usr/bin/time ./postgres -D /mnt/db1/ssd/tables/.t/data_jeff_bench/ -p 55432
+++ pgrep -P 61921
++ pid=61923
++ sleep 15
LOG: database system was shut down at 2012-07-02 11:30:16 CEST
LOG: autovacuum launcher started
LOG: database system is ready to accept connections
++ /usr/pgsql-9.1noslock/bin/pgbench -c32 -j32 -P -T60 -s100 -p 55432
bench_scale100_1
Scale option ignored, using pgbench_branches table count = 100
plgsql function created.
starting vacuum...end.
transaction type: SELECT only via plpgsql
scaling factor: 100
query mode: simple
number of clients: 32
number of threads: 32
duration: 60 s
number of transactions actually processed: 228
tps = 3.641156 (including connections establishing)
tps = 3.643482 (excluding connections establishing)
selects per second = 36411.559667 (including connections establishing)
selects per second = 36434.817110 (excluding connections establishing)
++ kill 61923
++ wait
LOG: received smart shutdown request
LOG: autovacuum launcher shutting down
LOG: shutting down
LOG: database system is shut down
1647.15user 175.14system 1:23.49elapsed 2182%CPU (0avgtext+0avgdata
3103952maxresident)k
0inputs+4224outputs (0major+5683435minor)pagefaults 0swaps
=== 32 threads 1 DB patched ===
++ pwd
/usr/pgsql-9.1noslock/bin
++ ppid=1051
++ /usr/bin/time ./postgres -D /mnt/db1/ssd/tables/.t/data_jeff_bench/ -p 55432
+++ pgrep -P 1051
++ pid=1053
++ sleep 15
LOG: database system was shut down at 2012-07-02 11:30:16 CEST
LOG: autovacuum launcher started
LOG: database system is ready to accept connections
++ /usr/pgsql-9.1noslock/bin/pgbench -c32 -j32 -P -T60 -s100 -p 55432
bench_scale100_1
Scale option ignored, using pgbench_branches table count = 100
plgsql function created.
starting vacuum...end.
transaction type: SELECT only via plpgsql
scaling factor: 100
query mode: simple
number of clients: 32
number of threads: 32
duration: 60 s
number of transactions actually processed: 190
tps = 2.717758 (including connections establishing)
tps = 2.719383 (excluding connections establishing)
selects per second = 27177.577274 (including connections establishing)
selects per second = 27193.834024 (excluding connections establishing)
++ kill 1053
++ wait
LOG: received smart shutdown request
LOG: autovacuum launcher shutting down
LOG: shutting down
LOG: database system is shut down
428.31user 585.52system 1:32.30elapsed 1098%CPU (0avgtext+0avgdata
2836128maxresident)k
0inputs+4448outputs (0major+5835601minor)pagefaults 0swaps
=== 64 threads 1 DB original code ===
++ pwd
/usr/pgsql-9.1/bin
++ ppid=8220
++ /usr/bin/time ./postgres -D /mnt/db1/ssd/tables/.t/data_jeff_bench/ -p 55432
+++ pgrep -P 8220
++ pid=8222
++ sleep 15
LOG: database system was shut down at 2012-07-02 11:30:16 CEST
LOG: database system is ready to accept connections
LOG: autovacuum launcher started
++ /usr/pgsql-9.1noslock/bin/pgbench -c64 -j64 -P -T60 -s100 -p 55432
bench_scale100_1
Scale option ignored, using pgbench_branches table count = 100
plgsql function created.
starting vacuum...end.
transaction type: SELECT only via plpgsql
scaling factor: 100
query mode: simple
number of clients: 64
number of threads: 64
duration: 60 s
number of transactions actually processed: 195
tps = 2.969237 (including connections establishing)
tps = 2.972496 (excluding connections establishing)
selects per second = 29692.373760 (including connections establishing)
selects per second = 29724.961208 (excluding connections establishing)
++ kill 8222
++ wait
LOG: received smart shutdown request
LOG: autovacuum launcher shutting down
LOG: shutting down
LOG: database system is shut down
2268.39user 439.51system 1:30.66elapsed 2986%CPU (0avgtext+0avgdata
2050464maxresident)k
0inputs+4432outputs (0major+7134606minor)pagefaults 0swaps
=== 64 threads 1 DB patched ===
++ pwd
/usr/pgsql-9.1noslock/bin
++ ppid=12542
++ /usr/bin/time ./postgres -D /mnt/db1/ssd/tables/.t/data_jeff_bench/ -p 55432
+++ pgrep -P 12542
++ pid=12544
++ sleep 15
LOG: database system was shut down at 2012-07-02 11:30:16 CEST
LOG: database system is ready to accept connections
LOG: autovacuum launcher started
++ /usr/pgsql-9.1noslock/bin/pgbench -c64 -j64 -P -T60 -s100 -p 55432
bench_scale100_1
Scale option ignored, using pgbench_branches table count = 100
plgsql function created.
starting vacuum...end.
transaction type: SELECT only via plpgsql
scaling factor: 100
query mode: simple
number of clients: 64
number of threads: 64
duration: 60 s
number of transactions actually processed: 192
tps = 2.410056 (including connections establishing)
tps = 2.412750 (excluding connections establishing)
selects per second = 24100.559887 (including connections establishing)
selects per second = 24127.504716 (excluding connections establishing)
++ kill 12544
++ wait
LOG: received smart shutdown request
LOG: autovacuum launcher shutting down
LOG: shutting down
LOG: database system is shut down
458.46user 886.33system 1:45.37elapsed 1276%CPU (0avgtext+0avgdata
2003472maxresident)k
0inputs+3856outputs (0major+7998883minor)pagefaults 0swaps
=== 128 threads 1 DB original code ===
++ pwd
/usr/pgsql-9.1/bin
++ ppid=46191
++ /usr/bin/time ./postgres -D /mnt/db1/ssd/tables/.t/data_jeff_bench/ -p 55432
+++ pgrep -P 46191
++ pid=46193
++ sleep 15
LOG: database system was shut down at 2012-07-02 11:30:16 CEST
LOG: autovacuum launcher started
LOG: database system is ready to accept connections
++ /usr/pgsql-9.1noslock/bin/pgbench -c128 -j128 -P -T60 -s100 -p 55432
bench_scale100_1
Scale option ignored, using pgbench_branches table count = 100
plgsql function created.
starting vacuum...end.
transaction type: SELECT only via plpgsql
scaling factor: 100
query mode: simple
number of clients: 128
number of threads: 128
duration: 60 s
number of transactions actually processed: 128
tps = 1.661937 (including connections establishing)
tps = 1.663827 (excluding connections establishing)
selects per second = 16619.373297 (including connections establishing)
selects per second = 16638.268091 (excluding connections establishing)
++ kill 46193
++ wait
LOG: received smart shutdown request
LOG: autovacuum launcher shutting down
LOG: shutting down
LOG: database system is shut down
2780.02user 322.67system 1:35.79elapsed 3238%CPU (0avgtext+0avgdata
1368576maxresident)k
0inputs+4400outputs (0major+7112920minor)pagefaults 0swaps
=== 128 threads 1 DB patched ===
++ pwd
/usr/pgsql-9.1noslock/bin
++ ppid=50278
++ /usr/bin/time ./postgres -D /mnt/db1/ssd/tables/.t/data_jeff_bench/ -p 55432
+++ pgrep -P 50278
++ pid=50280
++ sleep 15
LOG: database system was shut down at 2012-07-02 11:30:16 CEST
LOG: database system is ready to accept connections
LOG: autovacuum launcher started
++ /usr/pgsql-9.1noslock/bin/pgbench -c128 -j128 -P -T60 -s100 -p 55432
bench_scale100_1
Scale option ignored, using pgbench_branches table count = 100
plgsql function created.
starting vacuum...end.
transaction type: SELECT only via plpgsql
scaling factor: 100
query mode: simple
number of clients: 128
number of threads: 128
duration: 60 s
number of transactions actually processed: 256
tps = 2.273227 (including connections establishing)
tps = 2.275689 (excluding connections establishing)
selects per second = 22732.267812 (including connections establishing)
selects per second = 22756.889258 (excluding connections establishing)
++ kill 50280
++ wait
LOG: received smart shutdown request
LOG: autovacuum launcher shutting down
LOG: shutting down
LOG: database system is shut down
592.34user 1114.39system 2:12.96elapsed 1283%CPU (0avgtext+0avgdata
2003472maxresident)k
0inputs+3744outputs (0major+12355329minor)pagefaults 0swaps
=== 2x128 threads 2 DB original code ===
++ pwd
/usr/pgsql-9.1/bin
++ ppid=9841
++ /usr/bin/time ./postgres -D /mnt/db1/ssd/tables/.t/data_jeff_bench/ -p 55432
+++ pgrep -P 9841
++ pid=9843
++ sleep 15
LOG: database system was shut down at 2012-07-02 11:30:16 CEST
LOG: autovacuum launcher started
LOG: database system is ready to accept connections
++ typeset -a benchpids
++ for db in 'bench_scale100_{1..2}'
++ benchpids[${#benchpids[(at)]}]=10123
++ for db in 'bench_scale100_{1..2}'
++ /usr/pgsql-9.1noslock/bin/pgbench -c128 -j128 -P -T60 -s100 -p 55432
bench_scale100_1
++ benchpids[${#benchpids[(at)]}]=10124
++ wait 10123 10124
++ /usr/pgsql-9.1noslock/bin/pgbench -c128 -j128 -P -T60 -s100 -p 55432
bench_scale100_2
Scale option ignored, using pgbench_branches table count = 100
plgsql function created.
starting vacuum...Scale option ignored, using pgbench_branches table count = 100
plgsql function created.
starting vacuum...end.
end.
transaction type: SELECT only via plpgsql
scaling factor: 100
query mode: simple
number of clients: 128
number of threads: 128
duration: 60 s
number of transactions actually processed: 128
tps = 0.522012 (including connections establishing)
tps = 0.522310 (excluding connections establishing)
selects per second = 5220.116915 (including connections establishing)
selects per second = 5223.104689 (excluding connections establishing)
transaction type: SELECT only via plpgsql
scaling factor: 100
query mode: simple
number of clients: 128
number of threads: 128
duration: 60 s
number of transactions actually processed: 128
tps = 0.521770 (including connections establishing)
tps = 0.522186 (excluding connections establishing)
selects per second = 5217.696100 (including connections establishing)
selects per second = 5221.859622 (excluding connections establishing)
++ kill 9843
++ wait
LOG: received smart shutdown request
LOG: autovacuum launcher shutting down
LOG: shutting down
LOG: database system is shut down
9050.27user 523.88system 4:25.05elapsed 3612%CPU (0avgtext+0avgdata
1368560maxresident)k
0inputs+4304outputs (0major+15846016minor)pagefaults 0swaps
=== 2x128 threads 2 DB patched ===
++ pwd
/usr/pgsql-9.1noslock/bin
++ ppid=1494
++ /usr/bin/time ./postgres -D /mnt/db1/ssd/tables/.t/data_jeff_bench/ -p 55432
+++ pgrep -P 1494
++ pid=1496
++ sleep 15
LOG: database system was shut down at 2012-07-02 11:30:16 CEST
LOG: autovacuum launcher started
LOG: database system is ready to accept connections
++ typeset -a benchpids
++ for db in 'bench_scale100_{1..2}'
++ benchpids[${#benchpids[(at)]}]=2044
++ for db in 'bench_scale100_{1..2}'
++ /usr/pgsql-9.1noslock/bin/pgbench -c128 -j128 -P -T60 -s100 -p 55432
bench_scale100_1
++ benchpids[${#benchpids[(at)]}]=2045
++ wait 2044 2045
++ /usr/pgsql-9.1noslock/bin/pgbench -c128 -j128 -P -T60 -s100 -p 55432
bench_scale100_2
Scale option ignored, using pgbench_branches table count = 100
Scale option ignored, using pgbench_branches table count = 100
plgsql function created.
starting vacuum...plgsql function created.
starting vacuum...end.
end.
transaction type: SELECT only via plpgsql
scaling factor: 100
query mode: simple
number of clients: 128
number of threads: 128
duration: 60 s
number of transactions actually processed: 128
tps = 1.086408 (including connections establishing)
tps = 1.088396 (excluding connections establishing)
selects per second = 10864.079761 (including connections establishing)
selects per second = 10883.964930 (excluding connections establishing)
transaction type: SELECT only via plpgsql
scaling factor: 100
query mode: simple
number of clients: 128
number of threads: 128
duration: 60 s
number of transactions actually processed: 128
tps = 1.035884 (including connections establishing)
tps = 1.038104 (excluding connections establishing)
selects per second = 10358.836908 (including connections establishing)
selects per second = 10381.039715 (excluding connections establishing)
++ kill 1496
++ wait
LOG: received smart shutdown request
LOG: autovacuum launcher shutting down
FATAL: terminating autovacuum process due to administrator command
LOG: shutting down
LOG: database system is shut down
667.79user 1052.84system 2:24.75elapsed 1188%CPU (0avgtext+0avgdata
2003456maxresident)k
0inputs+3968outputs (0major+18333314minor)pagefaults 0swaps
| Attachment | Content-Type | Size |
|---|---|---|
| bench_128_2dbs.sh | application/x-shellscript | 695 bytes |
| bench_n.sh | application/x-shellscript | 685 bytes |
| summary_patched_vs_unpatched.pdf | application/pdf | 28.5 KB |
| From: | Robert Haas <robertmhaas(at)gmail(dot)com> |
|---|---|
| To: | Nils Goroll <slink(at)schokola(dot)de> |
| Cc: | Jeff Janes <jeff(dot)janes(at)gmail(dot)com>, Tom Lane <tgl(at)sss(dot)pgh(dot)pa(dot)us>, Martijn van Oosterhout <kleptog(at)svana(dot)org>, Merlin Moncure <mmoncure(at)gmail(dot)com>, pgsql-hackers(at)postgresql(dot)org |
| Subject: | Re: spinlock->pthread_mutex : first results with Jeff's pgbench+plsql |
| Date: | 2012-07-02 15:34:11 |
| Message-ID: | CA+Tgmoa=gs_Dw9dfbPO8DP2kR3pTMN6UWeTWU4fRxvtZXsSJ8Q@mail.gmail.com |
| Views: | Raw Message | Whole Thread | Download mbox | Resend email |
| Lists: | pgsql-hackers |
On Mon, Jul 2, 2012 at 11:26 AM, Nils Goroll <slink(at)schokola(dot)de> wrote:
> Please note that this is with 3.1.7. I understand that many scalability
> improvements have been implemented in later versions and it would have to be
> expected that using less synchronization points will imply that spinlock
> overhead is less. In other words, the results _should_ look less drastic with
> later versions.
3.1.7?
A major scalability bottleneck caused by spinlock contention was fixed
in 9.2 - see commit b4fbe392f8ff6ff1a66b488eb7197eef9e1770a4. I'm not
sure that it's very meaningful to do performance testing on versions
that are known to be out of date.
--
Robert Haas
EnterpriseDB: http://www.enterprisedb.com
The Enterprise PostgreSQL Company
| From: | Nils Goroll <slink(at)schokola(dot)de> |
|---|---|
| To: | Robert Haas <robertmhaas(at)gmail(dot)com> |
| Cc: | Jeff Janes <jeff(dot)janes(at)gmail(dot)com>, Tom Lane <tgl(at)sss(dot)pgh(dot)pa(dot)us>, Martijn van Oosterhout <kleptog(at)svana(dot)org>, Merlin Moncure <mmoncure(at)gmail(dot)com>, pgsql-hackers(at)postgresql(dot)org |
| Subject: | Re: spinlock->pthread_mutex : first results with Jeff's pgbench+plsql |
| Date: | 2012-07-02 15:38:08 |
| Message-ID: | 4FF1C060.9020704@schokola.de |
| Views: | Raw Message | Whole Thread | Download mbox | Resend email |
| Lists: | pgsql-hackers |
> 3.1.7?
Sorry, that was a typo. 9.1.3.
Yes, I had mentioned the Version in my initial posting. This version is the one
I need to work on as long as 9.2 is beta.
> A major scalability bottleneck caused by spinlock contention was fixed
> in 9.2 - see commit b4fbe392f8ff6ff1a66b488eb7197eef9e1770a4. I'm not
> sure that it's very meaningful to do performance testing on versions
> that are known to be out of date.
Apparently I have not pointed this out clearly enough. Sorry.
Nils
| From: | Robert Haas <robertmhaas(at)gmail(dot)com> |
|---|---|
| To: | Nils Goroll <slink(at)schokola(dot)de> |
| Cc: | Jeff Janes <jeff(dot)janes(at)gmail(dot)com>, Tom Lane <tgl(at)sss(dot)pgh(dot)pa(dot)us>, Martijn van Oosterhout <kleptog(at)svana(dot)org>, Merlin Moncure <mmoncure(at)gmail(dot)com>, pgsql-hackers(at)postgresql(dot)org |
| Subject: | Re: spinlock->pthread_mutex : first results with Jeff's pgbench+plsql |
| Date: | 2012-07-02 15:42:05 |
| Message-ID: | CA+TgmobxZPiC1ejY4Z3EoiSD8B+FFcvGF_DF5JPXzATTq9BkaA@mail.gmail.com |
| Views: | Raw Message | Whole Thread | Download mbox | Resend email |
| Lists: | pgsql-hackers |
On Mon, Jul 2, 2012 at 11:38 AM, Nils Goroll <slink(at)schokola(dot)de> wrote:
>> 3.1.7?
>
> Sorry, that was a typo. 9.1.3.
>
> Yes, I had mentioned the Version in my initial posting. This version is the one
> I need to work on as long as 9.2 is beta.
>
>> A major scalability bottleneck caused by spinlock contention was fixed
>> in 9.2 - see commit b4fbe392f8ff6ff1a66b488eb7197eef9e1770a4. I'm not
>> sure that it's very meaningful to do performance testing on versions
>> that are known to be out of date.
>
> Apparently I have not pointed this out clearly enough. Sorry.
You might try back-porting that one commit and see whether it fixes
your problem.
--
Robert Haas
EnterpriseDB: http://www.enterprisedb.com
The Enterprise PostgreSQL Company
| From: | Tom Lane <tgl(at)sss(dot)pgh(dot)pa(dot)us> |
|---|---|
| To: | Nils Goroll <slink(at)schokola(dot)de> |
| Cc: | Jeff Janes <jeff(dot)janes(at)gmail(dot)com>, Robert Haas <robertmhaas(at)gmail(dot)com>, Martijn van Oosterhout <kleptog(at)svana(dot)org>, Merlin Moncure <mmoncure(at)gmail(dot)com>, pgsql-hackers(at)postgresql(dot)org |
| Subject: | Re: spinlock->pthread_mutex : first results with Jeff's pgbench+plsql |
| Date: | 2012-07-02 16:20:02 |
| Message-ID: | 18400.1341246002@sss.pgh.pa.us |
| Views: | Raw Message | Whole Thread | Download mbox | Resend email |
| Lists: | pgsql-hackers |
Nils Goroll <slink(at)schokola(dot)de> writes:
> How I read this under the assumption that the test was correct and valid _and_
> can be reproduced independently:
> * for very low concurrency, the existing spinlock implementation is ideal -
> we can't do any better both in terms of resulting sps and resource
> consumption.
> One path to explore here would be PTHREAD_MUTEX_ADAPTIVE_NP, which essentially
> is the same as a spinlock for contended case with very low lock aquisition
> time. The code which I have tested uses PTHREAD_MUTEX_NORMAL, which, on Linux,
> will always syscall for the contended case.
> Quite clearly the overhead is with futexes syscalling, because kernel
> resource consumption is 3x higher with the patch than without.
> * With this benchmark, for "half" concurrency in the order of 0.5 x #cores,
> spinlocks still yield better tps, but resource overhead for spinlocks starts
> to take off and futexes are already 40% more efficient, despite the fact that
> spinlocks still have a 25% advantage in terms of sps.
> * At "full" concurrency (64 threads on 64 cores), resource consumption of
> the spinlocks leads to almost doubled overall resource consumption and
> the increased efficiency starts to pay off in terms of sps
> * and for the "quadruple overloaded" case (2x128 threads on 64 cores), spinlock
> contention really brings the system down and sps drops to half.
These conclusions seem plausible, though I agree we'd want to reproduce
similar behavior elsewhere before acting on the results.
What this seems to me to show, though, is that pthread mutexes are not
fundamentally a better technology than what we have now in spinlocks.
The problem is that the spinlock code is not adapting well to very high
levels of contention. I wonder whether a better and less invasive fix
could be had by playing with the rules for adjustment of
spins_per_delay. Right now, those are coded without any thought about
high-contention cases. In particular I wonder whether we ought to
try to determine which individual locks are high-contention, and behave
differently when trying to acquire those.
regards, tom lane
| From: | Robert Haas <robertmhaas(at)gmail(dot)com> |
|---|---|
| To: | Tom Lane <tgl(at)sss(dot)pgh(dot)pa(dot)us> |
| Cc: | Nils Goroll <slink(at)schokola(dot)de>, Jeff Janes <jeff(dot)janes(at)gmail(dot)com>, Martijn van Oosterhout <kleptog(at)svana(dot)org>, Merlin Moncure <mmoncure(at)gmail(dot)com>, pgsql-hackers(at)postgresql(dot)org |
| Subject: | Re: spinlock->pthread_mutex : first results with Jeff's pgbench+plsql |
| Date: | 2012-07-02 16:56:04 |
| Message-ID: | CA+Tgmoa4PaQ9s4coLms32rZJfF9Owgnmzas2OiSkrTP29fHFpw@mail.gmail.com |
| Views: | Raw Message | Whole Thread | Download mbox | Resend email |
| Lists: | pgsql-hackers |
On Mon, Jul 2, 2012 at 12:20 PM, Tom Lane <tgl(at)sss(dot)pgh(dot)pa(dot)us> wrote:
> What this seems to me to show, though, is that pthread mutexes are not
> fundamentally a better technology than what we have now in spinlocks.
> The problem is that the spinlock code is not adapting well to very high
> levels of contention. I wonder whether a better and less invasive fix
> could be had by playing with the rules for adjustment of
> spins_per_delay. Right now, those are coded without any thought about
> high-contention cases. In particular I wonder whether we ought to
> try to determine which individual locks are high-contention, and behave
> differently when trying to acquire those.
The delay code is stupider than it could be, in that it sleeps without
regard to what's happening elsewhere in the system. The futex stuff
was interesting to me because it potentially provides a way to sleep
"until something interesting happens" rather than "for a fixed amount
of time". But it's unclear to me what exactly we'd have to do to
squeeze out a win, or even whether it's possible.
The other side of this equation, too, is that a decent argument can be
made that spinlock contention should be fixed by reducing contention
rather than by contending more efficiently. The latter might help get
performance from "terrible" up to "poor" in a range of circumstances,
but I don't think it's going to get us all the way to "good".
--
Robert Haas
EnterpriseDB: http://www.enterprisedb.com
The Enterprise PostgreSQL Company
| From: | Tom Lane <tgl(at)sss(dot)pgh(dot)pa(dot)us> |
|---|---|
| To: | Robert Haas <robertmhaas(at)gmail(dot)com> |
| Cc: | Nils Goroll <slink(at)schokola(dot)de>, Jeff Janes <jeff(dot)janes(at)gmail(dot)com>, Martijn van Oosterhout <kleptog(at)svana(dot)org>, Merlin Moncure <mmoncure(at)gmail(dot)com>, pgsql-hackers(at)postgresql(dot)org |
| Subject: | Re: spinlock->pthread_mutex : first results with Jeff's pgbench+plsql |
| Date: | 2012-07-02 17:13:55 |
| Message-ID: | 19536.1341249235@sss.pgh.pa.us |
| Views: | Raw Message | Whole Thread | Download mbox | Resend email |
| Lists: | pgsql-hackers |
Robert Haas <robertmhaas(at)gmail(dot)com> writes:
> The delay code is stupider than it could be, in that it sleeps without
> regard to what's happening elsewhere in the system. The futex stuff
> was interesting to me because it potentially provides a way to sleep
> "until something interesting happens" rather than "for a fixed amount
> of time". But it's unclear to me what exactly we'd have to do to
> squeeze out a win, or even whether it's possible.
Right. AFAICS, sleeping "until something happens" necessarily requires
adding overhead on the other side, ie, lock releasers will have to do
something extra to wake up sleepers. If that means adding overhead
to low-contention cases, we could come out behind even if it improves
high-contention cases. Tradeoffs, always tradeoffs ...
regards, tom lane
| From: | Nils Goroll <slink(at)schokola(dot)de> |
|---|---|
| To: | Jeff Janes <jeff(dot)janes(at)gmail(dot)com> |
| Cc: | Robert Haas <robertmhaas(at)gmail(dot)com>, Tom Lane <tgl(at)sss(dot)pgh(dot)pa(dot)us>, Martijn van Oosterhout <kleptog(at)svana(dot)org>, Merlin Moncure <mmoncure(at)gmail(dot)com>, pgsql-hackers(at)postgresql(dot)org |
| Subject: | away soon - spinlock->pthread_mutex : first results with Jeff's pgbench+plsql |
| Date: | 2012-07-02 17:19:18 |
| Message-ID: | 4FF1D816.2020605@schokola.de |
| Views: | Raw Message | Whole Thread | Download mbox | Resend email |
| Lists: | pgsql-hackers |
btw, I really need to let go of this topic to catch up before going away at the
end of the week.
Thanks, Nils
| From: | Nils Goroll <slink(at)schokola(dot)de> |
|---|---|
| To: | Jeff Janes <jeff(dot)janes(at)gmail(dot)com> |
| Cc: | Robert Haas <robertmhaas(at)gmail(dot)com>, Tom Lane <tgl(at)sss(dot)pgh(dot)pa(dot)us>, Martijn van Oosterhout <kleptog(at)svana(dot)org>, Merlin Moncure <mmoncure(at)gmail(dot)com>, pgsql-hackers(at)postgresql(dot)org |
| Subject: | spinlock->pthread_mutex : real world results |
| Date: | 2012-08-05 23:19:27 |
| Message-ID: | 501EFF7F.9000400@schokola.de |
| Views: | Raw Message | Whole Thread | Download mbox | Resend email |
| Lists: | pgsql-hackers |
Hi,
meanwhile we're using the patch in production (again, this is 9.1.3) and after
running it under full load for one week I believe it is pretty safe to say that
replacing the spinlock code with pthread_mutexes on Linux (which basically are a
futex wrapper) has solved the scalability issue and all stability/performance
problems on this system are simply gone.
While the improved pgbench run had already given a clear indication regarding
the optimization potential, we can now be pretty certain that spinlock
contention had really been the most significant root cause for the issues I had
described in my early postings ("why roll-your-own s_lock? / improving
scalability" / "experimental: replace s_lock spinlock code with pthread_mutex on
linux").
I am attaching annotated graphs showing the load averages and cpu statistics of
the respective machine. Please note the fact that the highest spikes have been
averaged out in these graphs. As I had mentioned before, with the original code
in place we had seen saturation of 64 cores and load averages in excess of 300.
I fully agree that improvements in more recent pgsql code to reduce the number
of required locks or, even better, lockless data structures are the way to go,
but for the remaining cases it should now have become apparent that favoring
efficient mutex implementations is advantageous for large SMPs, where they exist
(e.g. futexes on Linux).
Thanks, Nils
| Attachment | Content-Type | Size |
|---|---|---|
| noslock_realworld_usr_sys_2.png | image/png | 114.6 KB |
| noslock_realworld_load_2.png | image/png | 123.3 KB |
| From: | Robert Haas <robertmhaas(at)gmail(dot)com> |
|---|---|
| To: | Nils Goroll <slink(at)schokola(dot)de> |
| Cc: | Jeff Janes <jeff(dot)janes(at)gmail(dot)com>, Tom Lane <tgl(at)sss(dot)pgh(dot)pa(dot)us>, Martijn van Oosterhout <kleptog(at)svana(dot)org>, Merlin Moncure <mmoncure(at)gmail(dot)com>, pgsql-hackers(at)postgresql(dot)org |
| Subject: | Re: spinlock->pthread_mutex : real world results |
| Date: | 2012-08-06 12:54:11 |
| Message-ID: | CA+TgmoZeMW5OZX1WzBXtieaTD0ySqJdauthoX_2NRZLc8_TxTw@mail.gmail.com |
| Views: | Raw Message | Whole Thread | Download mbox | Resend email |
| Lists: | pgsql-hackers |
On Sun, Aug 5, 2012 at 7:19 PM, Nils Goroll <slink(at)schokola(dot)de> wrote:
> meanwhile we're using the patch in production (again, this is 9.1.3) and
> after running it under full load for one week I believe it is pretty safe to
> say that replacing the spinlock code with pthread_mutexes on Linux (which
> basically are a futex wrapper) has solved the scalability issue and all
> stability/performance problems on this system are simply gone.
>
> While the improved pgbench run had already given a clear indication
> regarding the optimization potential, we can now be pretty certain that
> spinlock contention had really been the most significant root cause for the
> issues I had described in my early postings ("why roll-your-own s_lock? /
> improving scalability" / "experimental: replace s_lock spinlock code with
> pthread_mutex on linux").
>
> I am attaching annotated graphs showing the load averages and cpu statistics
> of the respective machine. Please note the fact that the highest spikes have
> been averaged out in these graphs. As I had mentioned before, with the
> original code in place we had seen saturation of 64 cores and load averages
> in excess of 300.
>
>
> I fully agree that improvements in more recent pgsql code to reduce the
> number of required locks or, even better, lockless data structures are the
> way to go, but for the remaining cases it should now have become apparent
> that favoring efficient mutex implementations is advantageous for large
> SMPs, where they exist (e.g. futexes on Linux).
Interesting data. I guess the questions in my mind are:
1. How much we're paying for this in the uncontended case?
2. Should we be modifying our spinlock implementation on Linux to use
futexes rather than pulling pthreads into the mix?
Anyone have data on the first point, or opinions on the second one?
I certainly think there is some potential here in terms of preventing
the worst-case situation where the entire machine ends up spending a
major portion of its CPU time in s_lock.
--
Robert Haas
EnterpriseDB: http://www.enterprisedb.com
The Enterprise PostgreSQL Company
| From: | Martijn van Oosterhout <kleptog(at)svana(dot)org> |
|---|---|
| To: | Robert Haas <robertmhaas(at)gmail(dot)com> |
| Cc: | Nils Goroll <slink(at)schokola(dot)de>, Jeff Janes <jeff(dot)janes(at)gmail(dot)com>, Tom Lane <tgl(at)sss(dot)pgh(dot)pa(dot)us>, Merlin Moncure <mmoncure(at)gmail(dot)com>, pgsql-hackers(at)postgresql(dot)org |
| Subject: | Re: spinlock->pthread_mutex : real world results |
| Date: | 2012-08-06 21:25:20 |
| Message-ID: | 20120806212520.GB20088@svana.org |
| Views: | Raw Message | Whole Thread | Download mbox | Resend email |
| Lists: | pgsql-hackers |
On Mon, Aug 06, 2012 at 08:54:11AM -0400, Robert Haas wrote:
> 2. Should we be modifying our spinlock implementation on Linux to use
> futexes rather than pulling pthreads into the mix?
>
> Anyone have data on the first point, or opinions on the second one?
I'm not sure whether pthreads is such a thick layer. Or are you
referring to the fact that you don't want to link against the library
at all?
If we've found a situation where our locks work better than the ones in
pthreads than either (a) we're doing something wrong or (b) the
pthreads implementation could do with improvement.
In either case it might be worth some investigation. If we can improve
the standard pthreads implementation everybody wins.
BTW, I read that some *BSDs have futex implementations (to emulate
linux), it might be an idea to see where they're going.
e.g. http://osdir.com/ml/os.dragonfly-bsd.kernel/2003-10/msg00232.html
Have a nice day,
--
Martijn van Oosterhout <kleptog(at)svana(dot)org> http://svana.org/kleptog/
> He who writes carelessly confesses thereby at the very outset that he does
> not attach much importance to his own thoughts.
-- Arthur Schopenhauer
| From: | Nils Goroll <slink(at)schokola(dot)de> |
|---|---|
| To: | Robert Haas <robertmhaas(at)gmail(dot)com> |
| Cc: | Jeff Janes <jeff(dot)janes(at)gmail(dot)com>, Tom Lane <tgl(at)sss(dot)pgh(dot)pa(dot)us>, Martijn van Oosterhout <kleptog(at)svana(dot)org>, Merlin Moncure <mmoncure(at)gmail(dot)com>, pgsql-hackers(at)postgresql(dot)org |
| Subject: | Re: spinlock->pthread_mutex : real world results |
| Date: | 2012-08-06 22:10:02 |
| Message-ID: | 502040BA.7010500@schokola.de |
| Views: | Raw Message | Whole Thread | Download mbox | Resend email |
| Lists: | pgsql-hackers |
Robert,
> 1. How much we're paying for this in the uncontended case?
Using glibc, we have the overhead of an additional library function call, which
we could eliminate by pulling in the code from glibc/nptl or a source of other
proven reference code.
The pgbench results I had posted before
http://archives.postgresql.org/pgsql-hackers/2012-07/msg00061.php could give an
indication on the higher base cost for the simple approach.
I have mentioned this before: While I agree that minimizing the base overhead is
good, IMHO, optimizing the worst case is the important part here.
Nils
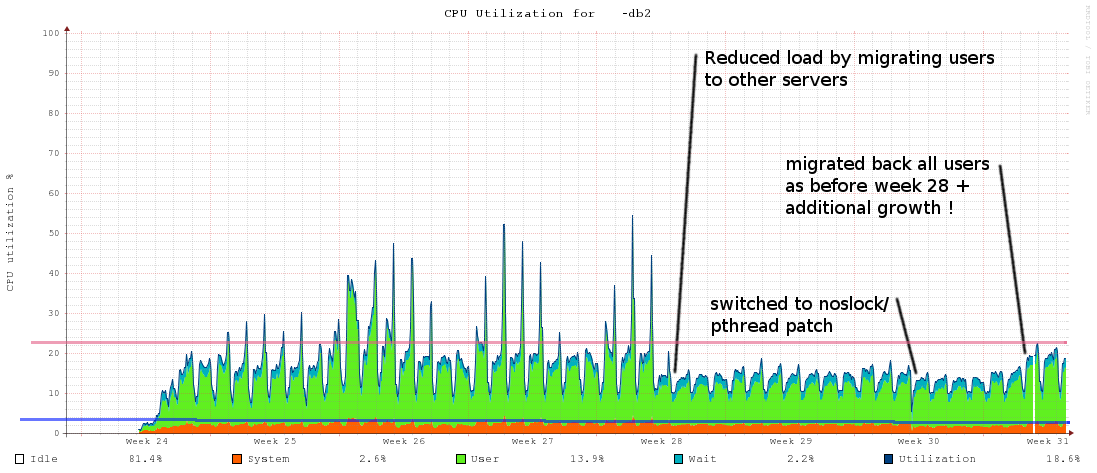
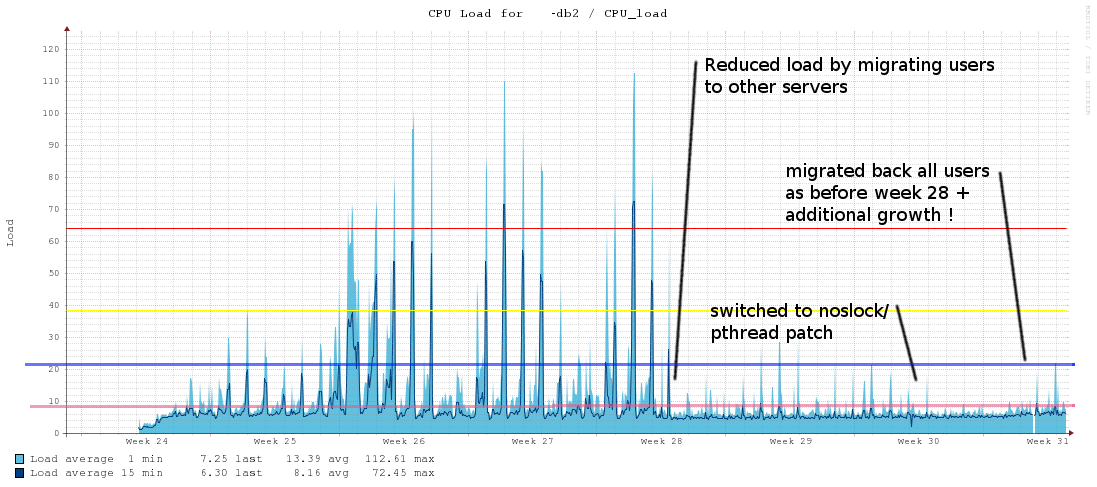