Re: ATTN: Clodaldo was Performance problem. Could it be related to 8.3-beta4?
| Lists: | pgsql-general |
|---|
| From: | "Scott Marlowe" <scott(dot)marlowe(at)gmail(dot)com> |
|---|---|
| To: | "PostgreSQL - General ML" <pgsql-general(at)postgresql(dot)org> |
| Subject: | ATTN: Clodaldo was Performance problem. Could it be related to 8.3-beta4? |
| Date: | 2008-01-10 16:58:16 |
| Message-ID: | dcc563d10801100858h6ea2b4b8j4cab3f85ec83c176@mail.gmail.com |
| Views: | Raw Message | Whole Thread | Download mbox | Resend email |
| Lists: | pgsql-general |
On Jan 10, 2008 9:50 AM, Clodoaldo <clodoaldo(dot)pinto(dot)neto(at)gmail(dot)com> wrote:
> I have seen performance degradation at every new version since 7.3.
> But now 8.3 is a complete disaster. It could be that my most expensive
> query is just a corner case, but I don't believe it. I posted about it
> but the whole thread disappeared from the archives. It can still be
> found here:
OK, I was looking at the previous thread that you thought had
disappeared, and with the explain analyze output from 8.3 I noticed
something odd.
For 8.2 you had something like this:
QUERY PLAN
------------------------------------------------------------------------------------------------------------------------------------------------------------------------
Subquery Scan "*SELECT*" (cost=326089.49..350310.28 rows=880756
width=20) (actual time=11444.566..13114.365 rows=880691 loops=1)
-> HashAggregate (cost=326089.49..339300.83 rows=880756 width=12)
(actual time=11444.554..12438.188 rows=880691 loops=1)
... SNIP ...
Time: 357750.531 ms
And for 8.3 you had something like this:
QUERY PLAN
------------------------------------------------------------------------------------------------------------------------------------------------------------------------
Subquery Scan "*SELECT*" (cost=316145.48..340289.33 rows=877958
width=20) (actual time=10650.036..12997.377 rows=877895 loops=1)
-> HashAggregate (cost=316145.48..329314.85 rows=877958 width=12)
(actual time=10650.023..12193.890 rows=877895 loops=1)
... SNIP ...
Time: 9547801.116 ms
In both of those instances, the actual time used is WAY larger than
the time listed in the explain analyze, which has usually pointed to a
very expensive OS level get time of day call.
How fast do these two queries run if you just run them. i.e. do
\timing
select ....
???
| From: | Clodoaldo <clodoaldo(dot)pinto(dot)neto(at)gmail(dot)com> |
|---|---|
| To: | "Scott Marlowe" <scott(dot)marlowe(at)gmail(dot)com> |
| Cc: | "PostgreSQL - General ML" <pgsql-general(at)postgresql(dot)org> |
| Subject: | Re: ATTN: Clodaldo was Performance problem. Could it be related to 8.3-beta4? |
| Date: | 2008-01-10 18:06:45 |
| Message-ID: | a595de7a0801101006v26a2cfeat8ca0ba4fa1212358@mail.gmail.com |
| Views: | Raw Message | Whole Thread | Download mbox | Resend email |
| Lists: | pgsql-general |
2008/1/10, Scott Marlowe <scott(dot)marlowe(at)gmail(dot)com>:
> On Jan 10, 2008 9:50 AM, Clodoaldo <clodoaldo(dot)pinto(dot)neto(at)gmail(dot)com> wrote:
>
> > I have seen performance degradation at every new version since 7.3.
> > But now 8.3 is a complete disaster. It could be that my most expensive
> > query is just a corner case, but I don't believe it. I posted about it
> > but the whole thread disappeared from the archives. It can still be
> > found here:
>
> OK, I was looking at the previous thread that you thought had
> disappeared, and with the explain analyze output from 8.3 I noticed
> something odd.
>
> For 8.2 you had something like this:
>
> QUERY PLAN
> ------------------------------------------------------------------------------------------------------------------------------------------------------------------------
> Subquery Scan "*SELECT*" (cost=326089.49..350310.28 rows=880756
> width=20) (actual time=11444.566..13114.365 rows=880691 loops=1)
> -> HashAggregate (cost=326089.49..339300.83 rows=880756 width=12)
> (actual time=11444.554..12438.188 rows=880691 loops=1)
> ... SNIP ...
> Time: 357750.531 ms
>
> And for 8.3 you had something like this:
> QUERY PLAN
> ------------------------------------------------------------------------------------------------------------------------------------------------------------------------
> Subquery Scan "*SELECT*" (cost=316145.48..340289.33 rows=877958
> width=20) (actual time=10650.036..12997.377 rows=877895 loops=1)
> -> HashAggregate (cost=316145.48..329314.85 rows=877958 width=12)
> (actual time=10650.023..12193.890 rows=877895 loops=1)
> ... SNIP ...
> Time: 9547801.116 ms
>
> In both of those instances, the actual time used is WAY larger than
> the time listed in the explain analyze, which has usually pointed to a
> very expensive OS level get time of day call.
If you read that thread you will notice my experience with
xlog_seg_size of 1GB which makes the time goes down to 1,300 sec,
still much more than 8.2. Could the bigger xlog_seg_size be
alleviating the expensive "OS level get time of day call", whatever it
means? With the standard xlog_seg_size, 16MB, I can see lots of file
activity in the pg_xlog directory. This fact made me guess
xlog_seg_size could be used to make things faster.
>
> How fast do these two queries run if you just run them. i.e. do
>
> \timing
> select ....
Without the explain analyze it ran in 7,642 sec although the second
time i ran it with explain analyze it ran in 7,683 sec. Yes, I did
analyze it before the first run of 9,547 sec. with explain analyze.
Regards, Clodoaldo Pinto Neto
| From: | Tom Lane <tgl(at)sss(dot)pgh(dot)pa(dot)us> |
|---|---|
| To: | "Scott Marlowe" <scott(dot)marlowe(at)gmail(dot)com> |
| Cc: | "PostgreSQL - General ML" <pgsql-general(at)postgresql(dot)org> |
| Subject: | Re: ATTN: Clodaldo was Performance problem. Could it be related to 8.3-beta4? |
| Date: | 2008-01-10 18:17:34 |
| Message-ID: | 8613.1199989054@sss.pgh.pa.us |
| Views: | Raw Message | Whole Thread | Download mbox | Resend email |
| Lists: | pgsql-general |
"Scott Marlowe" <scott(dot)marlowe(at)gmail(dot)com> writes:
> OK, I was looking at the previous thread that you thought had
> disappeared, and with the explain analyze output from 8.3 I noticed
> something odd.
> For 8.2 you had something like this:
> QUERY PLAN
> ------------------------------------------------------------------------------------------------------------------------------------------------------------------------
> Subquery Scan "*SELECT*" (cost=326089.49..350310.28 rows=880756
> width=20) (actual time=11444.566..13114.365 rows=880691 loops=1)
> -> HashAggregate (cost=326089.49..339300.83 rows=880756 width=12)
> (actual time=11444.554..12438.188 rows=880691 loops=1)
> ... SNIP ...
> Time: 357750.531 ms
> And for 8.3 you had something like this:
> QUERY PLAN
> ------------------------------------------------------------------------------------------------------------------------------------------------------------------------
> Subquery Scan "*SELECT*" (cost=316145.48..340289.33 rows=877958
> width=20) (actual time=10650.036..12997.377 rows=877895 loops=1)
> -> HashAggregate (cost=316145.48..329314.85 rows=877958 width=12)
> (actual time=10650.023..12193.890 rows=877895 loops=1)
> ... SNIP ...
> Time: 9547801.116 ms
> In both of those instances, the actual time used is WAY larger than
> the time listed in the explain analyze, which has usually pointed to a
> very expensive OS level get time of day call.
No, that's not it --- these last two runs are on the same OS.
Remember this command is an INSERT/SELECT. The total actual time for
the SELECT part of it (ie, forming the rows to insert) is what's
reported as the top-level plan node's runtime --- so 8.3 is actually a
shade faster than 8.2 here. And separately from that we can see the
time spent in the one foreign-key trigger, which seems to be slower on
8.3, but neither of these are where the majority of the runtime is
going. The rest of the runtime must be spent in the physical data
insertion --- storing the rows, updating the indexes, and/or writing
WAL. I don't see any particular reason for that to be so much worse in
8.3; especially not for such a simple table definition:
http://archives.postgresql.org/pgsql-general/2008-01/msg00266.php
There's something awfully weird going on there. I can replicate some
slowdown from 8.2 to 8.3, which should be looked into, but it's not the
order-of-magnitude-worse that Clodaldo is getting. I tried this simple
experiment, which should be at least comparable to his table structure:
create table foo (f1 int, f2 int, f3 int, f4 real);
create index fooi on foo(f1);
create index fooi2 on foo(f2);
explain analyze insert into foo select i,i,0,1.0 from generate_series(1,1000000) i;
and repeated the last a few times. On 8.2.6 I get numbers like this:
regression=# explain analyze insert into foo select i,i,0,1.0 from generate_series(1,1000000) i;
QUERY PLAN
-------------------------------------------------------------------------------------------------------------------------------
Function Scan on generate_series i (cost=0.00..12.50 rows=1000 width=4) (actual time=419.101..1408.868 rows=1000000 loops=1)
Total runtime: 16783.096 ms
(2 rows)
regression=# explain analyze insert into foo select i,i,0,1.0 from generate_series(1,1000000) i;
QUERY PLAN
-------------------------------------------------------------------------------------------------------------------------------
Function Scan on generate_series i (cost=0.00..12.50 rows=1000 width=4) (actual time=421.440..1512.787 rows=1000000 loops=1)
Total runtime: 18785.652 ms
(2 rows)
8.3RC1 gives numbers more like this:
regression=# explain analyze insert into foo select i,i,0,1.0 from generate_series(1,1000000) i;
QUERY PLAN
-------------------------------------------------------------------------------------------------------------------------------
Function Scan on generate_series i (cost=0.00..12.50 rows=1000 width=4) (actual time=420.742..1872.290 rows=1000000 loops=1)
Total runtime: 17278.170 ms
(2 rows)
regression=# explain analyze insert into foo select i,i,0,1.0 from generate_series(1,1000000) i;
QUERY PLAN
-------------------------------------------------------------------------------------------------------------------------------
Function Scan on generate_series i (cost=0.00..12.50 rows=1000 width=4) (actual time=435.392..1909.631 rows=1000000 loops=1)
Total runtime: 20673.453 ms
(2 rows)
This is my usual debugging setup, built --enable-debug --enable-cassert
but with "SET debug_assertions = 0" so that shouldn't affect things too much,
no configuration changes from what initdb gave me except fsync = off
(so it's not too representative of real-world performance, maybe).
It would be interesting to see the identical test on Clodaldo's
installations.
regards, tom lane
| From: | Alvaro Herrera <alvherre(at)commandprompt(dot)com> |
|---|---|
| To: | Clodoaldo <clodoaldo(dot)pinto(dot)neto(at)gmail(dot)com> |
| Cc: | Scott Marlowe <scott(dot)marlowe(at)gmail(dot)com>, PostgreSQL - General ML <pgsql-general(at)postgresql(dot)org> |
| Subject: | Re: ATTN: Clodaldo was Performance problem. Could it be related to 8.3-beta4? |
| Date: | 2008-01-10 18:20:13 |
| Message-ID: | 20080110182012.GP6465@alvh.no-ip.org |
| Views: | Raw Message | Whole Thread | Download mbox | Resend email |
| Lists: | pgsql-general |
Clodoaldo escribió:
> If you read that thread you will notice my experience with
> xlog_seg_size of 1GB which makes the time goes down to 1,300 sec,
> still much more than 8.2.
Do tell, what's your wal_buffers setting? Have you tried increasing
that?
--
Alvaro Herrera http://www.CommandPrompt.com/
The PostgreSQL Company - Command Prompt, Inc.
| From: | Greg Smith <gsmith(at)gregsmith(dot)com> |
|---|---|
| To: | Alvaro Herrera <alvherre(at)commandprompt(dot)com> |
| Cc: | Clodoaldo <clodoaldo(dot)pinto(dot)neto(at)gmail(dot)com>, PostgreSQL - General ML <pgsql-general(at)postgresql(dot)org> |
| Subject: | Re: ATTN: Clodaldo was Performance problem. Could it be related to 8.3-beta4? |
| Date: | 2008-01-10 18:30:58 |
| Message-ID: | Pine.GSO.4.64.0801101325530.24813@westnet.com |
| Views: | Raw Message | Whole Thread | Download mbox | Resend email |
| Lists: | pgsql-general |
On Thu, 10 Jan 2008, Alvaro Herrera wrote:
> Do tell, what's your wal_buffers setting? Have you tried increasing
> that?
Original post here suggested wal_buffers=512kb in 8.2 and 1024kb in the
8.3 config. Seemed plenty big for this scale of server.
--
* Greg Smith gsmith(at)gregsmith(dot)com http://www.gregsmith.com Baltimore, MD
| From: | Clodoaldo <clodoaldo(dot)pinto(dot)neto(at)gmail(dot)com> |
|---|---|
| To: | "Tom Lane" <tgl(at)sss(dot)pgh(dot)pa(dot)us> |
| Cc: | "Scott Marlowe" <scott(dot)marlowe(at)gmail(dot)com>, "PostgreSQL - General ML" <pgsql-general(at)postgresql(dot)org> |
| Subject: | Re: ATTN: Clodaldo was Performance problem. Could it be related to 8.3-beta4? |
| Date: | 2008-01-10 20:18:05 |
| Message-ID: | a595de7a0801101218q10b22c15p40ae5ef1b492aeb2@mail.gmail.com |
| Views: | Raw Message | Whole Thread | Download mbox | Resend email |
| Lists: | pgsql-general |
2008/1/10, Tom Lane <tgl(at)sss(dot)pgh(dot)pa(dot)us>:
> "Scott Marlowe" <scott(dot)marlowe(at)gmail(dot)com> writes:
> > OK, I was looking at the previous thread that you thought had
> > disappeared, and with the explain analyze output from 8.3 I noticed
> > something odd.
>
> > For 8.2 you had something like this:
>
> > QUERY PLAN
> > ------------------------------------------------------------------------------------------------------------------------------------------------------------------------
> > Subquery Scan "*SELECT*" (cost=326089.49..350310.28 rows=880756
> > width=20) (actual time=11444.566..13114.365 rows=880691 loops=1)
> > -> HashAggregate (cost=326089.49..339300.83 rows=880756 width=12)
> > (actual time=11444.554..12438.188 rows=880691 loops=1)
> > ... SNIP ...
> > Time: 357750.531 ms
>
> > And for 8.3 you had something like this:
> > QUERY PLAN
> > ------------------------------------------------------------------------------------------------------------------------------------------------------------------------
> > Subquery Scan "*SELECT*" (cost=316145.48..340289.33 rows=877958
> > width=20) (actual time=10650.036..12997.377 rows=877895 loops=1)
> > -> HashAggregate (cost=316145.48..329314.85 rows=877958 width=12)
> > (actual time=10650.023..12193.890 rows=877895 loops=1)
> > ... SNIP ...
> > Time: 9547801.116 ms
>
> > In both of those instances, the actual time used is WAY larger than
> > the time listed in the explain analyze, which has usually pointed to a
> > very expensive OS level get time of day call.
>
> No, that's not it --- these last two runs are on the same OS.
>
> Remember this command is an INSERT/SELECT. The total actual time for
> the SELECT part of it (ie, forming the rows to insert) is what's
> reported as the top-level plan node's runtime --- so 8.3 is actually a
> shade faster than 8.2 here. And separately from that we can see the
> time spent in the one foreign-key trigger, which seems to be slower on
> 8.3, but neither of these are where the majority of the runtime is
> going. The rest of the runtime must be spent in the physical data
> insertion --- storing the rows, updating the indexes, and/or writing
> WAL. I don't see any particular reason for that to be so much worse in
> 8.3; especially not for such a simple table definition:
> http://archives.postgresql.org/pgsql-general/2008-01/msg00266.php
>
> There's something awfully weird going on there. I can replicate some
> slowdown from 8.2 to 8.3, which should be looked into, but it's not the
> order-of-magnitude-worse that Clodaldo is getting. I tried this simple
> experiment, which should be at least comparable to his table structure:
>
> create table foo (f1 int, f2 int, f3 int, f4 real);
> create index fooi on foo(f1);
> create index fooi2 on foo(f2);
> explain analyze insert into foo select i,i,0,1.0 from generate_series(1,1000000) i;
>
> and repeated the last a few times. On 8.2.6 I get numbers like this:
>
> regression=# explain analyze insert into foo select i,i,0,1.0 from generate_series(1,1000000) i;
> QUERY PLAN
> -------------------------------------------------------------------------------------------------------------------------------
> Function Scan on generate_series i (cost=0.00..12.50 rows=1000 width=4) (actual time=419.101..1408.868 rows=1000000 loops=1)
> Total runtime: 16783.096 ms
> (2 rows)
>
> regression=# explain analyze insert into foo select i,i,0,1.0 from generate_series(1,1000000) i;
> QUERY PLAN
> -------------------------------------------------------------------------------------------------------------------------------
> Function Scan on generate_series i (cost=0.00..12.50 rows=1000 width=4) (actual time=421.440..1512.787 rows=1000000 loops=1)
> Total runtime: 18785.652 ms
> (2 rows)
>
> 8.3RC1 gives numbers more like this:
>
> regression=# explain analyze insert into foo select i,i,0,1.0 from generate_series(1,1000000) i;
> QUERY PLAN
> -------------------------------------------------------------------------------------------------------------------------------
> Function Scan on generate_series i (cost=0.00..12.50 rows=1000 width=4) (actual time=420.742..1872.290 rows=1000000 loops=1)
> Total runtime: 17278.170 ms
> (2 rows)
>
> regression=# explain analyze insert into foo select i,i,0,1.0 from generate_series(1,1000000) i;
> QUERY PLAN
> -------------------------------------------------------------------------------------------------------------------------------
> Function Scan on generate_series i (cost=0.00..12.50 rows=1000 width=4) (actual time=435.392..1909.631 rows=1000000 loops=1)
> Total runtime: 20673.453 ms
> (2 rows)
>
> This is my usual debugging setup, built --enable-debug --enable-cassert
> but with "SET debug_assertions = 0" so that shouldn't affect things too much,
> no configuration changes from what initdb gave me except fsync = off
> (so it's not too representative of real-world performance, maybe).
>
> It would be interesting to see the identical test on Clodaldo's
> installations.
This is 8.2.6 in the new server:
cpn=> create table foo (f1 int, f2 int, f3 int, f4 real);
CREATE TABLE
cpn=> create index fooi on foo(f1);
CREATE INDEX
cpn=> create index fooi2 on foo(f2);
CREATE INDEX
cpn=> explain analyze insert into foo select i,i,0,1.0 from
generate_series(1,1000000) i;
QUERY PLAN
------------------------------------------------------------------------------------------------------------------------------
Function Scan on generate_series i (cost=0.00..12.50 rows=1000
width=4) (actual time=270.425..699.067 rows=1000000 loops=1)
Total runtime: 12888.913 ms
(2 rows)
The table into which I'm inserting 800 thousand rows, usuarios, has
135 million rows so I did:
cpn=> explain analyze insert into foo select i,i,0,1.0 from
generate_series(1,135500000) i;
QUERY
PLAN
-------------------------------------------------------------------------------------------------------------------------------------
Function Scan on generate_series i (cost=0.00..12.50 rows=1000
width=4) (actual time=49852.161..403976.519 rows=135500000 loops=1)
Total runtime: 2044745.294 ms
(2 rows)
cpn=> analyze;
...warnings...
ANALYZE
cpn=> explain analyze insert into foo select i,i,0,1.0 from
generate_series(135500001, 135500000 + 800000 ) i;
QUERY PLAN
-----------------------------------------------------------------------------------------------------------------------------
Function Scan on generate_series i (cost=0.00..12.50 rows=1000
width=4) (actual time=196.804..553.617 rows=800000 loops=1)
Total runtime: 11202.895 ms
(2 rows)
The real table has foreign keys. Don't it make a difference?
I can reinstall 8.3 and try it. Will it be necessary or interesting?
beta4 or RC1?
Regards, Clodoaldo Pinto Neto
| From: | Clodoaldo <clodoaldo(dot)pinto(dot)neto(at)gmail(dot)com> |
|---|---|
| To: | "Tom Lane" <tgl(at)sss(dot)pgh(dot)pa(dot)us> |
| Cc: | "Scott Marlowe" <scott(dot)marlowe(at)gmail(dot)com>, "PostgreSQL - General ML" <pgsql-general(at)postgresql(dot)org> |
| Subject: | Re: ATTN: Clodaldo was Performance problem. Could it be related to 8.3-beta4? |
| Date: | 2008-01-11 13:50:03 |
| Message-ID: | a595de7a0801110550k7e067969u19f4b5a072d9f20b@mail.gmail.com |
| Views: | Raw Message | Whole Thread | Download mbox | Resend email |
| Lists: | pgsql-general |
2008/1/10, Clodoaldo <clodoaldo(dot)pinto(dot)neto(at)gmail(dot)com>:
> 2008/1/10, Tom Lane <tgl(at)sss(dot)pgh(dot)pa(dot)us>:
> > It would be interesting to see the identical test on Clodaldo's
> > installations.
>
> This is 8.2.6 in the new server:
>
> cpn=> create table foo (f1 int, f2 int, f3 int, f4 real);
> CREATE TABLE
> cpn=> create index fooi on foo(f1);
> CREATE INDEX
> cpn=> create index fooi2 on foo(f2);
> CREATE INDEX
> cpn=> explain analyze insert into foo select i,i,0,1.0 from
> generate_series(1,1000000) i;
> QUERY PLAN
> ------------------------------------------------------------------------------------------------------------------------------
> Function Scan on generate_series i (cost=0.00..12.50 rows=1000
> width=4) (actual time=270.425..699.067 rows=1000000 loops=1)
> Total runtime: 12888.913 ms
> (2 rows)
>
> The table into which I'm inserting 800 thousand rows, usuarios, has
> 135 million rows so I did:
>
> cpn=> explain analyze insert into foo select i,i,0,1.0 from
> generate_series(1,135500000) i;
>
> QUERY
> PLAN
> -------------------------------------------------------------------------------------------------------------------------------------
> Function Scan on generate_series i (cost=0.00..12.50 rows=1000
> width=4) (actual time=49852.161..403976.519 rows=135500000 loops=1)
> Total runtime: 2044745.294 ms
> (2 rows)
> cpn=> analyze;
> ...warnings...
> ANALYZE
> cpn=> explain analyze insert into foo select i,i,0,1.0 from
> generate_series(135500001, 135500000 + 800000 ) i;
> QUERY PLAN
> -----------------------------------------------------------------------------------------------------------------------------
> Function Scan on generate_series i (cost=0.00..12.50 rows=1000
> width=4) (actual time=196.804..553.617 rows=800000 loops=1)
> Total runtime: 11202.895 ms
> (2 rows)
Now the same with 8.3RC1 at the new server:
cpn=> create table foo (f1 int, f2 int, f3 int, f4 real);
CREATE TABLE
cpn=> create index fooi on foo(f1);
CREATE INDEX
cpn=> create index fooi2 on foo(f2);
CREATE INDEX
cpn=> explain analyze insert into foo select i,i,0,1.0 from
generate_series(1,1000000) i;
QUERY PLAN
-------------------------------------------------------------------------------------------------------------------------------
Function Scan on generate_series i (cost=0.00..12.50 rows=1000
width=4) (actual time=495.995..1103.326 rows=1000000 loops=1)
Total runtime: 13380.214 ms
(2 rows)
cpn=> explain analyze insert into foo select i,i,0,1.0 from
generate_series(1,1000000) i;
QUERY PLAN
-------------------------------------------------------------------------------------------------------------------------------
Function Scan on generate_series i (cost=0.00..12.50 rows=1000
width=4) (actual time=469.872..1111.901 rows=1000000 loops=1)
Total runtime: 18640.398 ms
(2 rows)
cpn=> explain analyze insert into foo select i,i,0,1.0 from
generate_series(1,1000000) i;
QUERY PLAN
------------------------------------------------------------------------------------------------------------------------------
Function Scan on generate_series i (cost=0.00..12.50 rows=1000
width=4) (actual time=294.671..929.198 rows=1000000 loops=1)
Total runtime: 16704.956 ms
(2 rows)
cpn=> explain analyze insert into foo select i,i,0,1.0 from
cpn-> generate_series(1,135500000) i;
QUERY
PLAN
-------------------------------------------------------------------------------------------------------------------------------------
Function Scan on generate_series i (cost=0.00..12.50 rows=1000
width=4) (actual time=54032.804..342699.642 rows=135500000 loops=1)
Total runtime: 1687252.668 ms
(2 rows)
cpn=> analyze;
...warnings...
ANALYZE
cpn=> explain analyze insert into foo select i,i,0,1.0 from
cpn-> generate_series(135500001, 135500000 + 800000 ) i;
QUERY PLAN
-----------------------------------------------------------------------------------------------------------------------------
Function Scan on generate_series i (cost=0.00..12.50 rows=1000
width=4) (actual time=244.565..733.050 rows=800000 loops=1)
Total runtime: 9689.809 ms
(2 rows)
Regards, Clodoaldo Pinto Neto
| From: | Clodoaldo <clodoaldo(dot)pinto(dot)neto(at)gmail(dot)com> |
|---|---|
| To: | "Tom Lane" <tgl(at)sss(dot)pgh(dot)pa(dot)us> |
| Cc: | "Scott Marlowe" <scott(dot)marlowe(at)gmail(dot)com>, "PostgreSQL - General ML" <pgsql-general(at)postgresql(dot)org> |
| Subject: | Re: ATTN: Clodaldo was Performance problem. Could it be related to 8.3-beta4? |
| Date: | 2008-01-11 14:24:06 |
| Message-ID: | a595de7a0801110624m78b8558fmf5d2a0dc2d54172@mail.gmail.com |
| Views: | Raw Message | Whole Thread | Download mbox | Resend email |
| Lists: | pgsql-general |
2008/1/11, Clodoaldo <clodoaldo(dot)pinto(dot)neto(at)gmail(dot)com>:
> 2008/1/10, Clodoaldo <clodoaldo(dot)pinto(dot)neto(at)gmail(dot)com>:
> > 2008/1/10, Tom Lane <tgl(at)sss(dot)pgh(dot)pa(dot)us>:
> > > It would be interesting to see the identical test on Clodaldo's
> > > installations.
> >
> > This is 8.2.6 in the new server:
> >
> > cpn=> create table foo (f1 int, f2 int, f3 int, f4 real);
> > CREATE TABLE
> > cpn=> create index fooi on foo(f1);
> > CREATE INDEX
> > cpn=> create index fooi2 on foo(f2);
> > CREATE INDEX
> > cpn=> explain analyze insert into foo select i,i,0,1.0 from
> > generate_series(1,1000000) i;
> > QUERY PLAN
> > ------------------------------------------------------------------------------------------------------------------------------
> > Function Scan on generate_series i (cost=0.00..12.50 rows=1000
> > width=4) (actual time=270.425..699.067 rows=1000000 loops=1)
> > Total runtime: 12888.913 ms
> > (2 rows)
> >
> > The table into which I'm inserting 800 thousand rows, usuarios, has
> > 135 million rows so I did:
> >
> > cpn=> explain analyze insert into foo select i,i,0,1.0 from
> > generate_series(1,135500000) i;
> >
> > QUERY
> > PLAN
> > -------------------------------------------------------------------------------------------------------------------------------------
> > Function Scan on generate_series i (cost=0.00..12.50 rows=1000
> > width=4) (actual time=49852.161..403976.519 rows=135500000 loops=1)
> > Total runtime: 2044745.294 ms
> > (2 rows)
> > cpn=> analyze;
> > ...warnings...
> > ANALYZE
> > cpn=> explain analyze insert into foo select i,i,0,1.0 from
> > generate_series(135500001, 135500000 + 800000 ) i;
> > QUERY PLAN
> > -----------------------------------------------------------------------------------------------------------------------------
> > Function Scan on generate_series i (cost=0.00..12.50 rows=1000
> > width=4) (actual time=196.804..553.617 rows=800000 loops=1)
> > Total runtime: 11202.895 ms
> > (2 rows)
>
> Now the same with 8.3RC1 at the new server:
>
> cpn=> create table foo (f1 int, f2 int, f3 int, f4 real);
> CREATE TABLE
> cpn=> create index fooi on foo(f1);
> CREATE INDEX
> cpn=> create index fooi2 on foo(f2);
> CREATE INDEX
> cpn=> explain analyze insert into foo select i,i,0,1.0 from
> generate_series(1,1000000) i;
> QUERY PLAN
> -------------------------------------------------------------------------------------------------------------------------------
> Function Scan on generate_series i (cost=0.00..12.50 rows=1000
> width=4) (actual time=495.995..1103.326 rows=1000000 loops=1)
> Total runtime: 13380.214 ms
> (2 rows)
>
> cpn=> explain analyze insert into foo select i,i,0,1.0 from
> generate_series(1,1000000) i;
> QUERY PLAN
> -------------------------------------------------------------------------------------------------------------------------------
> Function Scan on generate_series i (cost=0.00..12.50 rows=1000
> width=4) (actual time=469.872..1111.901 rows=1000000 loops=1)
> Total runtime: 18640.398 ms
> (2 rows)
>
> cpn=> explain analyze insert into foo select i,i,0,1.0 from
> generate_series(1,1000000) i;
> QUERY PLAN
> ------------------------------------------------------------------------------------------------------------------------------
> Function Scan on generate_series i (cost=0.00..12.50 rows=1000
> width=4) (actual time=294.671..929.198 rows=1000000 loops=1)
> Total runtime: 16704.956 ms
> (2 rows)
>
> cpn=> explain analyze insert into foo select i,i,0,1.0 from
> cpn-> generate_series(1,135500000) i;
> QUERY
> PLAN
> -------------------------------------------------------------------------------------------------------------------------------------
> Function Scan on generate_series i (cost=0.00..12.50 rows=1000
> width=4) (actual time=54032.804..342699.642 rows=135500000 loops=1)
> Total runtime: 1687252.668 ms
> (2 rows)
>
> cpn=> analyze;
> ...warnings...
> ANALYZE
> cpn=> explain analyze insert into foo select i,i,0,1.0 from
> cpn-> generate_series(135500001, 135500000 + 800000 ) i;
> QUERY PLAN
> -----------------------------------------------------------------------------------------------------------------------------
> Function Scan on generate_series i (cost=0.00..12.50 rows=1000
> width=4) (actual time=244.565..733.050 rows=800000 loops=1)
> Total runtime: 9689.809 ms
> (2 rows)
Tom,
I guess the samples above are not very useful. If you think it would
help, i can upload the database dump, along with the source txt files
and the insert script, to some web directory, so you can see it
working. Its bziped size is 914MB so I will only upload it if you say
yes.
Regards, Clodoaldo Pinto Neto
| From: | Alvaro Herrera <alvherre(at)commandprompt(dot)com> |
|---|---|
| To: | Clodoaldo <clodoaldo(dot)pinto(dot)neto(at)gmail(dot)com> |
| Cc: | Tom Lane <tgl(at)sss(dot)pgh(dot)pa(dot)us>, Scott Marlowe <scott(dot)marlowe(at)gmail(dot)com>, PostgreSQL - General ML <pgsql-general(at)postgresql(dot)org> |
| Subject: | Re: ATTN: Clodaldo was Performance problem. Could it be related to 8.3-beta4? |
| Date: | 2008-01-15 23:02:25 |
| Message-ID: | 20080115230225.GO4473@alvh.no-ip.org |
| Views: | Raw Message | Whole Thread | Download mbox | Resend email |
| Lists: | pgsql-general |
Clodoaldo escribió:
> I guess the samples above are not very useful. If you think it would
> help, i can upload the database dump, along with the source txt files
> and the insert script, to some web directory, so you can see it
> working. Its bziped size is 914MB so I will only upload it if you say
> yes.
Did anything happen?
--
Alvaro Herrera http://www.CommandPrompt.com/
PostgreSQL Replication, Consulting, Custom Development, 24x7 support
| From: | Clodoaldo <clodoaldo(dot)pinto(dot)neto(at)gmail(dot)com> |
|---|---|
| To: | "Alvaro Herrera" <alvherre(at)commandprompt(dot)com> |
| Cc: | "Tom Lane" <tgl(at)sss(dot)pgh(dot)pa(dot)us>, "Scott Marlowe" <scott(dot)marlowe(at)gmail(dot)com>, "PostgreSQL - General ML" <pgsql-general(at)postgresql(dot)org> |
| Subject: | Re: ATTN: Clodaldo was Performance problem. Could it be related to 8.3-beta4? |
| Date: | 2008-01-15 23:56:21 |
| Message-ID: | a595de7a0801151556x3330ca89nc34948f73ee0a453@mail.gmail.com |
| Views: | Raw Message | Whole Thread | Download mbox | Resend email |
| Lists: | pgsql-general |
2008/1/15, Alvaro Herrera <alvherre(at)commandprompt(dot)com>:
> Clodoaldo escribió:
>
> > I guess the samples above are not very useful. If you think it would
> > help, i can upload the database dump, along with the source txt files
> > and the insert script, to some web directory, so you can see it
> > working. Its bziped size is 914MB so I will only upload it if you say
> > yes.
>
> Did anything happen?
Not that I know about. On a side note I tried the 7z format and the
size is 457 MB in instead of the 914 MB of the bzip2 format.
Regards, Clodoaldo Pinto Neto
| From: | Tom Lane <tgl(at)sss(dot)pgh(dot)pa(dot)us> |
|---|---|
| To: | Clodoaldo <clodoaldo(dot)pinto(dot)neto(at)gmail(dot)com> |
| Cc: | "Scott Marlowe" <scott(dot)marlowe(at)gmail(dot)com>, "PostgreSQL - General ML" <pgsql-general(at)postgresql(dot)org> |
| Subject: | Re: ATTN: Clodaldo was Performance problem. Could it be related to 8.3-beta4? |
| Date: | 2008-01-16 04:39:38 |
| Message-ID: | 17789.1200458378@sss.pgh.pa.us |
| Views: | Raw Message | Whole Thread | Download mbox | Resend email |
| Lists: | pgsql-general |
I went through this thread again, and noticed something that no one
seems to have remarked on at the time: the vmstat numbers near the
bottom of this post
http://archives.postgresql.org/pgsql-general/2008-01/msg00161.php
show close to 100% I/O wait time (either that or 50% idle 50% I/O wait,
which I suspect is an artifact). We subsequently concluded that the
"SELECT" side of the INSERT/SELECT command is not where the problem is,
so all the cycles are going into the actual row insertion part.
I don't know of any reason to think that insertion is slower in 8.3
than it was in 8.2, and no one else has reported anything of the sort.
So I'm leaning to the idea that this suggests some kind of
misconfiguration of the disk setup in Clodoaldo's new server. There
was some earlier discussion about not having the RAID configured right:
http://archives.postgresql.org/pgsql-general/2008-01/msg00169.php
I'm thinking it's still not right :-( but have no real expertise
at diagnosing such problems. Anyone?
regards, tom lane
| From: | "Joshua D(dot) Drake" <jd(at)commandprompt(dot)com> |
|---|---|
| To: | Tom Lane <tgl(at)sss(dot)pgh(dot)pa(dot)us> |
| Cc: | Clodoaldo <clodoaldo(dot)pinto(dot)neto(at)gmail(dot)com>, Scott Marlowe <scott(dot)marlowe(at)gmail(dot)com>, PostgreSQL - General ML <pgsql-general(at)postgresql(dot)org> |
| Subject: | Re: ATTN: Clodaldo was Performance problem. Could it be related to 8.3-beta4? |
| Date: | 2008-01-16 05:16:55 |
| Message-ID: | 478D9347.1000501@commandprompt.com |
| Views: | Raw Message | Whole Thread | Download mbox | Resend email |
| Lists: | pgsql-general |
Tom Lane wrote:
> I went through this thread again, and noticed something that no one
> seems to have remarked on at the time: the vmstat numbers near the
> bottom of this post
>
> http://archives.postgresql.org/pgsql-general/2008-01/msg00161.php
>
> show close to 100% I/O wait time (either that or 50% idle 50% I/O wait,
> which I suspect is an artifact). We subsequently concluded that the
> "SELECT" side of the INSERT/SELECT command is not where the problem is,
> so all the cycles are going into the actual row insertion part.
>
> I don't know of any reason to think that insertion is slower in 8.3
> than it was in 8.2, and no one else has reported anything of the sort.
> So I'm leaning to the idea that this suggests some kind of
> misconfiguration of the disk setup in Clodoaldo's new server. There
> was some earlier discussion about not having the RAID configured right:
>
> http://archives.postgresql.org/pgsql-general/2008-01/msg00169.php
>
> I'm thinking it's still not right :-( but have no real expertise
> at diagnosing such problems. Anyone?
Per the thread.
# cat /proc/mdstat
Personalities : [raid1] [raid6] [raid5] [raid4] [raid0]
md2 : active raid1 sda1[0] sdb1[1]
224768 blocks [2/2] [UU]
md0 : active raid0 sda2[0] sdb2[1]
4497920 blocks 256k chunks
md1 : active raid1 sda3[0] sdb3[1]
310094592 blocks [2/2] [UU]
I don't see anything immediately wrong here. md0 is raid 0 and probably
his swap. md2 is probably boot and md1 is probably / . All volumes show
online.
If we are sure that this issue is apparent actual row insertion it
should be easy to duplicate. I will do some testing on my box which is
similar. I have 2gig of ram, dual core and a raid 1 with SATA drives.
Sincerely,
Joshua D. Drake
>
> regards, tom lane
>
> ---------------------------(end of broadcast)---------------------------
> TIP 5: don't forget to increase your free space map settings
>
| From: | Tom Lane <tgl(at)sss(dot)pgh(dot)pa(dot)us> |
|---|---|
| To: | "Joshua D(dot) Drake" <jd(at)commandprompt(dot)com> |
| Cc: | Clodoaldo <clodoaldo(dot)pinto(dot)neto(at)gmail(dot)com>, Scott Marlowe <scott(dot)marlowe(at)gmail(dot)com>, PostgreSQL - General ML <pgsql-general(at)postgresql(dot)org> |
| Subject: | Re: ATTN: Clodaldo was Performance problem. Could it be related to 8.3-beta4? |
| Date: | 2008-01-16 05:29:16 |
| Message-ID: | 18240.1200461356@sss.pgh.pa.us |
| Views: | Raw Message | Whole Thread | Download mbox | Resend email |
| Lists: | pgsql-general |
"Joshua D. Drake" <jd(at)commandprompt(dot)com> writes:
> If we are sure that this issue is apparent actual row insertion it
> should be easy to duplicate.
I think you missed my point entirely: I believe it's specific to
Clodoaldo's installation. Certainly I didn't have any luck reproducing
a huge 8.2-to-8.3 slowdown here.
regards, tom lane
| From: | "Joshua D(dot) Drake" <jd(at)commandprompt(dot)com> |
|---|---|
| To: | Tom Lane <tgl(at)sss(dot)pgh(dot)pa(dot)us> |
| Cc: | Clodoaldo <clodoaldo(dot)pinto(dot)neto(at)gmail(dot)com>, Scott Marlowe <scott(dot)marlowe(at)gmail(dot)com>, PostgreSQL - General ML <pgsql-general(at)postgresql(dot)org> |
| Subject: | Re: ATTN: Clodaldo was Performance problem. Could it be related to 8.3-beta4? |
| Date: | 2008-01-16 05:57:06 |
| Message-ID: | 20080115215706.277dd9af@commandprompt.com |
| Views: | Raw Message | Whole Thread | Download mbox | Resend email |
| Lists: | pgsql-general |
-----BEGIN PGP SIGNED MESSAGE-----
Hash: SHA1
On Wed, 16 Jan 2008 00:29:16 -0500
Tom Lane <tgl(at)sss(dot)pgh(dot)pa(dot)us> wrote:
> "Joshua D. Drake" <jd(at)commandprompt(dot)com> writes:
> > If we are sure that this issue is apparent actual row insertion it
> > should be easy to duplicate.
>
> I think you missed my point entirely: I believe it's specific to
Wouldn't be the first time.
> Clodoaldo's installation. Certainly I didn't have any luck
> reproducing a huge 8.2-to-8.3 slowdown here.
Well I would agree that all the testing that I have done doesn't show
8.3 being slower. I do see this though in the very first post:
http://archives.postgresql.org/pgsql-general/2008-01/msg00143.php
Production: Fedora Core 6, postgresql 8.2.5, AMD XP2600, 2 GB mem, two
7200 ide disks with pg_xlog alone in the second disk.
New: Fedora 8, postgresql 8.3-beta4, Core Duo 2.33 MHz, 4 GB mem, two
7200 sata disks in Raid 1.
On the old machine pg_xlog is on its own disk but on the new machine he
is getting random churn on the I/O because he only has the RAID 1 for
DATA and pg_xlog.
He tested 8.3 on the old box and had similar results. Although, I wonder
if he tested 8.3b4 on the old box in the exact disk layout (with xlog
on a separate disk).
http://archives.postgresql.org/pgsql-general/2008-01/msg00214.php
He only says he built and copied the postgreql.conf.
Sincerely,
Joshua D. Drake
>
> regards, tom lane
>
- --
The PostgreSQL Company: Since 1997, http://www.commandprompt.com/
Sales/Support: +1.503.667.4564 24x7/Emergency: +1.800.492.2240
Donate to the PostgreSQL Project: http://www.postgresql.org/about/donate
SELECT 'Training', 'Consulting' FROM vendor WHERE name = 'CMD'
-----BEGIN PGP SIGNATURE-----
Version: GnuPG v1.4.6 (GNU/Linux)
iD8DBQFHjZy1ATb/zqfZUUQRAsppAJ9cEqB9XG/rzItK0ZxdzGDgPYSGiQCZAfI8
6OTY+HdE6fKR4DvlBJYYMtM=
=rjPB
-----END PGP SIGNATURE-----
| From: | Clodoaldo <clodoaldo(dot)pinto(dot)neto(at)gmail(dot)com> |
|---|---|
| To: | "Joshua D(dot) Drake" <jd(at)commandprompt(dot)com> |
| Cc: | "Tom Lane" <tgl(at)sss(dot)pgh(dot)pa(dot)us>, "Scott Marlowe" <scott(dot)marlowe(at)gmail(dot)com>, "PostgreSQL - General ML" <pgsql-general(at)postgresql(dot)org> |
| Subject: | Re: ATTN: Clodaldo was Performance problem. Could it be related to 8.3-beta4? |
| Date: | 2008-01-16 10:21:28 |
| Message-ID: | a595de7a0801160221j60588ee3kfbd710769b750ab9@mail.gmail.com |
| Views: | Raw Message | Whole Thread | Download mbox | Resend email |
| Lists: | pgsql-general |
2008/1/16, Joshua D. Drake <jd(at)commandprompt(dot)com>:
> -----BEGIN PGP SIGNED MESSAGE-----
> Hash: SHA1
>
> On Wed, 16 Jan 2008 00:29:16 -0500
> Tom Lane <tgl(at)sss(dot)pgh(dot)pa(dot)us> wrote:
>
> > "Joshua D. Drake" <jd(at)commandprompt(dot)com> writes:
> > > If we are sure that this issue is apparent actual row insertion it
> > > should be easy to duplicate.
> >
> > I think you missed my point entirely: I believe it's specific to
>
> Wouldn't be the first time.
>
> > Clodoaldo's installation. Certainly I didn't have any luck
> > reproducing a huge 8.2-to-8.3 slowdown here.
>
> Well I would agree that all the testing that I have done doesn't show
> 8.3 being slower. I do see this though in the very first post:
>
> http://archives.postgresql.org/pgsql-general/2008-01/msg00143.php
>
> Production: Fedora Core 6, postgresql 8.2.5, AMD XP2600, 2 GB mem, two
> 7200 ide disks with pg_xlog alone in the second disk.
> New: Fedora 8, postgresql 8.3-beta4, Core Duo 2.33 MHz, 4 GB mem, two
> 7200 sata disks in Raid 1.
>
> On the old machine pg_xlog is on its own disk but on the new machine he
> is getting random churn on the I/O because he only has the RAID 1 for
> DATA and pg_xlog.
>
> He tested 8.3 on the old box and had similar results.
No, I tested 8.3 only on the new box where I also tested 8.2. If it is
a hardware problem, what I don't know how to investigate, it is only
triggered by 8.3. When I tested 8.3 and 8.2 in the new box the raid
problem was apparently fixed as you noted.
> Although, I wonder
> if he tested 8.3b4 on the old box in the exact disk layout (with xlog
> on a separate disk).
I didn't test 8.3 on the old box. Now the new box is already the
production box running 8.2.6 and I can't test on it anymore, but I can
test everything again in the old box. That would rule out the raid
factor. I will have to wait for the weekend.
Regards, Clodoaldo Pinto Neto
| From: | Clodoaldo <clodoaldo(dot)pinto(dot)neto(at)gmail(dot)com> |
|---|---|
| To: | "Tom Lane" <tgl(at)sss(dot)pgh(dot)pa(dot)us> |
| Cc: | "Scott Marlowe" <scott(dot)marlowe(at)gmail(dot)com>, "PostgreSQL - General ML" <pgsql-general(at)postgresql(dot)org> |
| Subject: | Re: ATTN: Clodaldo was Performance problem. Could it be related to 8.3-beta4? |
| Date: | 2008-01-16 10:32:50 |
| Message-ID: | a595de7a0801160232h17430860m2f643b70f943d9f3@mail.gmail.com |
| Views: | Raw Message | Whole Thread | Download mbox | Resend email |
| Lists: | pgsql-general |
2008/1/16, Tom Lane <tgl(at)sss(dot)pgh(dot)pa(dot)us>:
> I went through this thread again, and noticed something that no one
> seems to have remarked on at the time: the vmstat numbers near the
> bottom of this post
>
> http://archives.postgresql.org/pgsql-general/2008-01/msg00161.php
This post is from january 5.
> show close to 100% I/O wait time (either that or 50% idle 50% I/O wait,
> which I suspect is an artifact). We subsequently concluded that the
> "SELECT" side of the INSERT/SELECT command is not where the problem is,
> so all the cycles are going into the actual row insertion part.
>
> I don't know of any reason to think that insertion is slower in 8.3
> than it was in 8.2, and no one else has reported anything of the sort.
> So I'm leaning to the idea that this suggests some kind of
> misconfiguration of the disk setup in Clodoaldo's new server. There
> was some earlier discussion about not having the RAID configured right:
>
> http://archives.postgresql.org/pgsql-general/2008-01/msg00169.php
This post is from january 6. So the raid problem was presumed fixed
after those vmsat numbers I posted.
> I'm thinking it's still not right :
I will test both 8.2 and 8.3 again in the old box which is now retired
and don't have the raid factor.
Regards, Clodoaldo Pinto Neto
| From: | Clodoaldo <clodoaldo(dot)pinto(dot)neto(at)gmail(dot)com> |
|---|---|
| To: | "Tom Lane" <tgl(at)sss(dot)pgh(dot)pa(dot)us> |
| Cc: | "Scott Marlowe" <scott(dot)marlowe(at)gmail(dot)com>, "PostgreSQL - General ML" <pgsql-general(at)postgresql(dot)org> |
| Subject: | Re: ATTN: Clodaldo was Performance problem. Could it be related to 8.3-beta4? |
| Date: | 2008-01-18 22:38:24 |
| Message-ID: | a595de7a0801181438w5ed1f624s52bce348dca51a71@mail.gmail.com |
| Views: | Raw Message | Whole Thread | Download mbox | Resend email |
| Lists: | pgsql-general |
2008/1/16, Tom Lane <tgl(at)sss(dot)pgh(dot)pa(dot)us>:
> I went through this thread again, and noticed something that no one
> seems to have remarked on at the time: the vmstat numbers near the
> bottom of this post
>
> http://archives.postgresql.org/pgsql-general/2008-01/msg00161.php
>
> show close to 100% I/O wait time (either that or 50% idle 50% I/O wait,
> which I suspect is an artifact). We subsequently concluded that the
> "SELECT" side of the INSERT/SELECT command is not where the problem is,
> so all the cycles are going into the actual row insertion part.
>
> I don't know of any reason to think that insertion is slower in 8.3
> than it was in 8.2, and no one else has reported anything of the sort.
> So I'm leaning to the idea that this suggests some kind of
> misconfiguration of the disk setup in Clodoaldo's new server. There
> was some earlier discussion about not having the RAID configured right:
Now it is tested in this configuration, the old server:
Fedora Core 6, AMD XP2600, 2 GB mem, two
7200 ide disks with pg_xlog alone in the second disk.
This is 8.2.6:
fahstats=# explain analyze
fahstats-# insert into usuarios (
fahstats(# data,
fahstats(# usuario,
fahstats(# pontos,
fahstats(# wus
fahstats(# )
fahstats-# select
fahstats-# (select data_serial from data_serial) as data,
fahstats-# ui.usuario_serial as usuario,
fahstats-# sum(pontos) as pontos,
fahstats-# sum(wus) as wus
fahstats-# from usuarios_temp as ut inner join usuarios_indice as ui
fahstats-# on ut.usuario = ui.usuario_nome and ut.n_time = ui.n_time
fahstats-# group by data, ui.usuario_serial
fahstats-# ;
QUERY PLAN
Subquery Scan "*SELECT*" (cost=307438.81..331782.20 rows=885214
width=20) (actual time=31433.335..35989.973 rows=885281 loops=1)
-> HashAggregate (cost=307438.81..320717.02 rows=885214 width=12)
(actual time=31433.318..33886.039 rows=885281 loops=1)
InitPlan
-> Seq Scan on data_serial (cost=0.00..1.01 rows=1
width=4) (actual time=0.016..0.018 rows=1 loops=1)
-> Merge Join (cost=102838.10..254834.62 rows=5260318
width=12) (actual time=12146.535..29242.146 rows=891140 loops=1)
Merge Cond: ((ut.n_time = ui.n_time) AND
((ut.usuario)::text = "inner"."?column4?"))
-> Index Scan using usuarios_temp_ndx on usuarios_temp
ut (cost=0.00..55486.37 rows=891140 width=26) (actual
time=0.217..8457.332 rows=891140 loops=1)
-> Sort (cost=102838.10..105051.14 rows=885214
width=22) (actual time=12146.264..13215.173 rows=891180 loops=1)
Sort Key: ui.n_time, (ui.usuario_nome)::text
-> Seq Scan on usuarios_indice ui
(cost=0.00..15398.14 rows=885214 width=22) (actual
time=0.055..1266.373 rows=885321 loops=1)
Trigger for constraint datas: time=28494.257 calls=885281
Total runtime: 824920.034 ms
(12 rows)
Time: 825219.242 ms
8.3RC1:
QUERY PLAN
Subquery Scan "*SELECT*" (cost=315346.40..339490.66 rows=877973
width=20) (actual time=28527.088..34628.084 rows=877895 loops=1)
-> HashAggregate (cost=315346.40..328516.00 rows=877973 width=12)
(actual time=28527.060..32082.655 rows=877895 loops=1)
InitPlan
-> Seq Scan on data_serial (cost=0.00..1.01 rows=1
width=4) (actual time=0.018..0.021 rows=1 loops=1)
-> Merge Join (cost=101200.86..257473.27 rows=5787212
width=12) (actual time=9796.697..25537.218 rows=883729 loops=1)
Merge Cond: ((ut.n_time = ui.n_time) AND
((ut.usuario)::text = (ui.usuario_nome)::text))
-> Index Scan using usuarios_temp_ndx on usuarios_temp
ut (cost=0.00..50587.20 rows=883729 width=23) (actual
time=0.254..6940.743 rows=883729 loops=1)
-> Sort (cost=101199.42..103394.35 rows=877973
width=19) (actual time=9796.386..10962.868 rows=883769 loops=1)
Sort Key: ui.n_time, ui.usuario_nome
Sort Method: quicksort Memory: 63286kB
-> Seq Scan on usuarios_indice ui
(cost=0.00..14526.73 rows=877973 width=19) (actual
time=0.080..1158.713 rows=877935 loops=1)
Trigger for constraint datas: time=44379.117 calls=877895
Total runtime: 8865110.176 ms
(13 rows)
Time: 8865629.601 ms
Both versions where analized before running.
The old server reproduces the behavior of the new one.
Regards, Clodoaldo Pinto Neto
| From: | Tom Lane <tgl(at)sss(dot)pgh(dot)pa(dot)us> |
|---|---|
| To: | Clodoaldo <clodoaldo(dot)pinto(dot)neto(at)gmail(dot)com> |
| Cc: | "Scott Marlowe" <scott(dot)marlowe(at)gmail(dot)com>, "PostgreSQL - General ML" <pgsql-general(at)postgresql(dot)org> |
| Subject: | Re: ATTN: Clodaldo was Performance problem. Could it be related to 8.3-beta4? |
| Date: | 2008-01-19 00:37:01 |
| Message-ID: | 14687.1200703021@sss.pgh.pa.us |
| Views: | Raw Message | Whole Thread | Download mbox | Resend email |
| Lists: | pgsql-general |
Clodoaldo <clodoaldo(dot)pinto(dot)neto(at)gmail(dot)com> writes:
> The old server reproduces the behavior of the new one.
Well, that's just weird. Let's see, FC6 has oprofile --- maybe oprofile
measurements on 8.2 and 8.3 on the same box would tell something.
Do you know how to use that? Alternatively, if you could give me ssh
access to the box, I'd be willing to do the measuring. But oprofile
requires root access so maybe that's more than you want to trust me ...
regards, tom lane
| From: | Tom Lane <tgl(at)sss(dot)pgh(dot)pa(dot)us> |
|---|---|
| To: | Clodoaldo <clodoaldo(dot)pinto(dot)neto(at)gmail(dot)com> |
| Cc: | "Scott Marlowe" <scott(dot)marlowe(at)gmail(dot)com>, "PostgreSQL - General ML" <pgsql-general(at)postgresql(dot)org> |
| Subject: | Re: ATTN: Clodaldo was Performance problem. Could it be related to 8.3-beta4? |
| Date: | 2008-01-20 03:33:00 |
| Message-ID: | 2669.1200799980@sss.pgh.pa.us |
| Views: | Raw Message | Whole Thread | Download mbox | Resend email |
| Lists: | pgsql-general |
Clodoaldo <clodoaldo(dot)pinto(dot)neto(at)gmail(dot)com> writes:
> 2008/1/16, Tom Lane <tgl(at)sss(dot)pgh(dot)pa(dot)us>:
>> I don't know of any reason to think that insertion is slower in 8.3
>> than it was in 8.2, and no one else has reported anything of the sort.
> The old server reproduces the behavior of the new one.
Okay, Clodoaldo kindly gave me access to his old server, and after
nearly a full day of poking at it I think I've figured out what is going
on. Recall that the problem query is
insert into usuarios (
data,
usuario,
pontos,
wus
)
select
(select data_serial from data_serial) as data,
ui.usuario_serial as usuario,
sum(pontos) as pontos,
sum(wus) as wus
from usuarios_temp as ut inner join usuarios_indice as ui
on ut.usuario = ui.usuario_nome and ut.n_time = ui.n_time
group by data, ui.usuario_serial
;
for which both 8.2 and 8.3 select a plan along the lines of
Subquery Scan "*SELECT*" (cost=318139.26..342283.02 rows=877955 width=20)
-> HashAggregate (cost=318139.26..331308.58 rows=877955 width=12)
InitPlan
-> Seq Scan on data_serial (cost=0.00..1.01 rows=1 width=4)
-> Merge Join (cost=101944.33..261142.53 rows=5699572 width=12)
Merge Cond: ((ut.n_time = ui.n_time) AND ((ut.usuario)::text = "inner"."?column4?"))
-> Index Scan using usuarios_temp_ndx on usuarios_temp ut (cost=0.00..55038.92 rows=883729 width=26)
-> Sort (cost=101944.33..104139.22 rows=877955 width=22)
Sort Key: ui.n_time, (ui.usuario_nome)::text
-> Seq Scan on usuarios_indice ui (cost=0.00..15273.55 rows=877955 width=22)
and the target table has non-unique indexes on "data" and "usuario"
(which are both simple integer columns, no surprises there).
I first tried running this query with "usuarios" initially empty, and
both 8.2 and 8.3 did fine. However, in the real scenario that Clodoaldo
is worried about, there's somewhere north of 135 million entries in
"usuarios" to begin with, and in that case 8.3 falls off a cliff while
8.2 doesn't --- the INSERT query takes about 400 seconds in 8.2 while
I gave up at 2h20m with 8.3. Why is that? Well, it turns out that 8.3
is thrashing a lot harder than 8.2 is. Each index on "usuarios" is
about 2.3GB (the same in both versions) and the server has only 2GB RAM,
so it's not real surprising that the working set might be more than RAM;
but why is 8.3 worse than 8.2?
You can see from the query that it's inserting the same constant "data"
value into every new row, and if I understand the context correctly this
value will be higher than all prior entries in the "usuarios" table. So
all the new entries in the "data" index are at the right-hand edge of
the index, and only a fairly small footprint is being touched at any
instant. strace'ing confirms that neither 8.2 nor 8.3 do much I/O at
all on that index. It's the index on the "usuario" column that is
thrashing.
The difference comes from the fact that the HashAggregate step --- which
is being done on hashing columns (data, usuario) --- is effectively
reading out in hash-value order for usuario, meaning that that is the
order in which we make index insertions. 8.2 had an extremely chintzy
hash function for integers --- basically just return the negative of the
integer value --- while 8.3 takes it seriously and produces a nicely
randomized hash value. This means that the usuario values are returned
in a relatively well ordered fashion in 8.2 and a nearly totally random
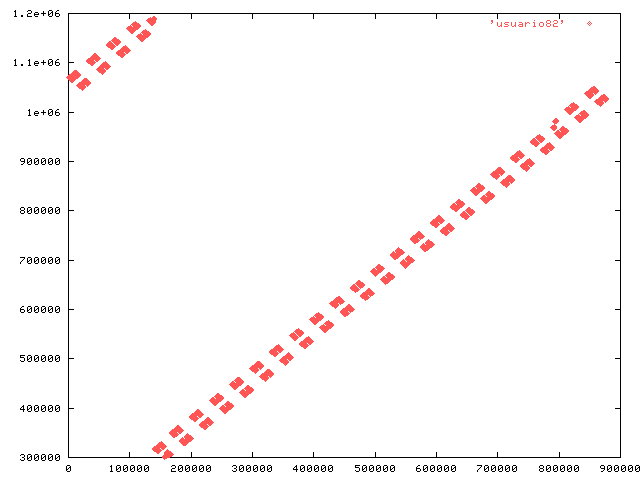
one in 8.3. I captured the output of the SELECT in both 8.2 and 8.3;
attached are plots showing the usuario values against row number. From
this we can see that 8.2 has a working set that is a relatively small
part of the index at any instant, whereas 8.3 has the entire index as
working set ... and it doesn't fit into RAM. Ergo, lots of disk seek
delays.
I don't think we want to back off the improved hashing functions in 8.3
--- in most scenarios they should lead to significantly better
performance. But in this particular context they hurt.
A possibly usable workaround for now is "set enable_hashagg = off"
to force a GroupAggregate plan, which will deliver the values sorted
by (data, usuario) rather than by their hash values. This helps both
versions, bringing the runtime down to something like 250 seconds,
because the index on usuario then has complete locality of access.
Alternatively, doubling the server's RAM would probably make the problem
go away (for awhile, until the index reaches 4GB).
In the long run, for queries inserting many rows it might be interesting
to accumulate all the entries intended for a btree index and sort them
before inserting. Not sure about possible downsides of that.
regards, tom lane
| Attachment | Content-Type | Size |
|---|---|---|
|
image/png | 4.0 KB |

|
image/png | 2.4 KB |
| From: | Russell Smith <mr-russ(at)pws(dot)com(dot)au> |
|---|---|
| To: | PostgreSQL - General ML <pgsql-general(at)postgresql(dot)org> |
| Cc: | Tom Lane <tgl(at)sss(dot)pgh(dot)pa(dot)us> |
| Subject: | Re: ATTN: Clodaldo was Performance problem. Could it be related to 8.3-beta4? |
| Date: | 2008-01-20 06:34:27 |
| Message-ID: | 4792EB73.1060208@pws.com.au |
| Views: | Raw Message | Whole Thread | Download mbox | Resend email |
| Lists: | pgsql-general |
Tom Lane wrote:
> Clodoaldo <clodoaldo(dot)pinto(dot)neto(at)gmail(dot)com> writes:
>
>> 2008/1/16, Tom Lane <tgl(at)sss(dot)pgh(dot)pa(dot)us>:
>>
>>> I don't know of any reason to think that insertion is slower in 8.3
>>> than it was in 8.2, and no one else has reported anything of the sort.
>>>
>
>
>> The old server reproduces the behavior of the new one.
>>
>
> Okay, Clodoaldo kindly gave me access to his old server, and after
> nearly a full day of poking at it I think I've figured out what is going
> on. Recall that the problem query is
>
> insert into usuarios (
> data,
> usuario,
> pontos,
> wus
> )
> select
> (select data_serial from data_serial) as data,
> ui.usuario_serial as usuario,
> sum(pontos) as pontos,
> sum(wus) as wus
> from usuarios_temp as ut inner join usuarios_indice as ui
> on ut.usuario = ui.usuario_nome and ut.n_time = ui.n_time
> group by data, ui.usuario_serial
> ;
>
> for which both 8.2 and 8.3 select a plan along the lines of
>
> Subquery Scan "*SELECT*" (cost=318139.26..342283.02 rows=877955 width=20)
> -> HashAggregate (cost=318139.26..331308.58 rows=877955 width=12)
> InitPlan
> -> Seq Scan on data_serial (cost=0.00..1.01 rows=1 width=4)
> -> Merge Join (cost=101944.33..261142.53 rows=5699572 width=12)
> Merge Cond: ((ut.n_time = ui.n_time) AND ((ut.usuario)::text = "inner"."?column4?"))
> -> Index Scan using usuarios_temp_ndx on usuarios_temp ut (cost=0.00..55038.92 rows=883729 width=26)
> -> Sort (cost=101944.33..104139.22 rows=877955 width=22)
> Sort Key: ui.n_time, (ui.usuario_nome)::text
> -> Seq Scan on usuarios_indice ui (cost=0.00..15273.55 rows=877955 width=22)
>
> and the target table has non-unique indexes on "data" and "usuario"
> (which are both simple integer columns, no surprises there).
>
> I first tried running this query with "usuarios" initially empty, and
> both 8.2 and 8.3 did fine. However, in the real scenario that Clodoaldo
> is worried about, there's somewhere north of 135 million entries in
> "usuarios" to begin with, and in that case 8.3 falls off a cliff while
> 8.2 doesn't --- the INSERT query takes about 400 seconds in 8.2 while
> I gave up at 2h20m with 8.3. Why is that? Well, it turns out that 8.3
> is thrashing a lot harder than 8.2 is. Each index on "usuarios" is
> about 2.3GB (the same in both versions) and the server has only 2GB RAM,
> so it's not real surprising that the working set might be more than RAM;
> but why is 8.3 worse than 8.2?
>
> You can see from the query that it's inserting the same constant "data"
> value into every new row, and if I understand the context correctly this
> value will be higher than all prior entries in the "usuarios" table. So
> all the new entries in the "data" index are at the right-hand edge of
> the index, and only a fairly small footprint is being touched at any
> instant. strace'ing confirms that neither 8.2 nor 8.3 do much I/O at
> all on that index. It's the index on the "usuario" column that is
> thrashing.
>
> The difference comes from the fact that the HashAggregate step --- which
> is being done on hashing columns (data, usuario) --- is effectively
> reading out in hash-value order for usuario, meaning that that is the
> order in which we make index insertions. 8.2 had an extremely chintzy
> hash function for integers --- basically just return the negative of the
> integer value --- while 8.3 takes it seriously and produces a nicely
> randomized hash value. This means that the usuario values are returned
> in a relatively well ordered fashion in 8.2 and a nearly totally random
> one in 8.3. I captured the output of the SELECT in both 8.2 and 8.3;
> attached are plots showing the usuario values against row number. From
> this we can see that 8.2 has a working set that is a relatively small
> part of the index at any instant, whereas 8.3 has the entire index as
> working set ... and it doesn't fit into RAM. Ergo, lots of disk seek
> delays.
>
> I don't think we want to back off the improved hashing functions in 8.3
> --- in most scenarios they should lead to significantly better
> performance. But in this particular context they hurt.
>
> A possibly usable workaround for now is "set enable_hashagg = off"
> to force a GroupAggregate plan, which will deliver the values sorted
> by (data, usuario) rather than by their hash values. This helps both
> versions, bringing the runtime down to something like 250 seconds,
> because the index on usuario then has complete locality of access.
> Alternatively, doubling the server's RAM would probably make the problem
> go away (for awhile, until the index reaches 4GB).
>
> In the long run, for queries inserting many rows it might be interesting
> to accumulate all the entries intended for a btree index and sort them
> before inserting. Not sure about possible downsides of that.
>
If you add ORDER BY to the query, do you get different results?
The timing may be better/worse than the results you got with hashagg off.
However it seems slightly less brute than trun hashagg off.
Regards
Russell Smith
| From: | Martijn van Oosterhout <kleptog(at)svana(dot)org> |
|---|---|
| To: | Tom Lane <tgl(at)sss(dot)pgh(dot)pa(dot)us> |
| Cc: | Clodoaldo <clodoaldo(dot)pinto(dot)neto(at)gmail(dot)com>, Scott Marlowe <scott(dot)marlowe(at)gmail(dot)com>, PostgreSQL - General ML <pgsql-general(at)postgresql(dot)org> |
| Subject: | Re: ATTN: Clodaldo was Performance problem. Could it be related to 8.3-beta4? |
| Date: | 2008-01-20 10:36:24 |
| Message-ID: | 20080120103624.GA9599@svana.org |
| Views: | Raw Message | Whole Thread | Download mbox | Resend email |
| Lists: | pgsql-general |
On Sat, Jan 19, 2008 at 10:33:00PM -0500, Tom Lane wrote:
> The difference comes from the fact that the HashAggregate step --- which
> is being done on hashing columns (data, usuario) --- is effectively
> reading out in hash-value order for usuario, meaning that that is the
> order in which we make index insertions. 8.2 had an extremely chintzy
> hash function for integers --- basically just return the negative of the
> integer value --- while 8.3 takes it seriously and produces a nicely
> randomized hash value. This means that the usuario values are returned
> in a relatively well ordered fashion in 8.2 and a nearly totally random
> one in 8.3.
A random thought: Is there not some way of representing this difference
in the planner? We store the correlation for tables, could it not be
argued that the output of a hash plan is correlation zero, whereas an
indexscan may have higher correlation... A low correlation works
against plans returning lots of rows.
Have a nice day,
--
Martijn van Oosterhout <kleptog(at)svana(dot)org> http://svana.org/kleptog/
> Those who make peaceful revolution impossible will make violent revolution inevitable.
> -- John F Kennedy
| From: | Clodoaldo <clodoaldo(dot)pinto(dot)neto(at)gmail(dot)com> |
|---|---|
| To: | "Tom Lane" <tgl(at)sss(dot)pgh(dot)pa(dot)us> |
| Cc: | "Scott Marlowe" <scott(dot)marlowe(at)gmail(dot)com>, "PostgreSQL - General ML" <pgsql-general(at)postgresql(dot)org> |
| Subject: | Re: ATTN: Clodaldo was Performance problem. Could it be related to 8.3-beta4? |
| Date: | 2008-01-20 11:29:16 |
| Message-ID: | a595de7a0801200329g5bd19961xeb534e84c7043176@mail.gmail.com |
| Views: | Raw Message | Whole Thread | Download mbox | Resend email |
| Lists: | pgsql-general |
2008/1/20, Tom Lane <tgl(at)sss(dot)pgh(dot)pa(dot)us>:
> Clodoaldo <clodoaldo(dot)pinto(dot)neto(at)gmail(dot)com> writes:
> > 2008/1/16, Tom Lane <tgl(at)sss(dot)pgh(dot)pa(dot)us>:
> >> I don't know of any reason to think that insertion is slower in 8.3
> >> than it was in 8.2, and no one else has reported anything of the sort.
>
> > The old server reproduces the behavior of the new one.
>
> Okay, Clodoaldo kindly gave me access to his old server, and after
> nearly a full day of poking at it I think I've figured out what is going
> on.
Thank you very much for working on this. That server will still be
available for a while if you want to poke further.
> You can see from the query that it's inserting the same constant "data"
> value into every new row, and if I understand the context correctly this
> value will be higher than all prior entries in the "usuarios" table.
Yes, that is correct. That value is this:
nextval('datas_data_serial_seq'::regclass)
> From
> this we can see that 8.2 has a working set that is a relatively small
> part of the index at any instant, whereas 8.3 has the entire index as
> working set ... and it doesn't fit into RAM. Ergo, lots of disk seek
> delays.
...
> A possibly usable workaround for now is "set enable_hashagg = off"
> to force a GroupAggregate plan, which will deliver the values sorted
> by (data, usuario) rather than by their hash values. This helps both
> versions, bringing the runtime down to something like 250 seconds,
> because the index on usuario then has complete locality of access.
> Alternatively, doubling the server's RAM would probably make the problem
> go away (for awhile, until the index reaches 4GB).
I need to say that the new server has 4GB and suffers the same
symptoms. OTOH if the proposed solution works then I wonder if it
matters.
Will "enable_hashagg" be settable(*) per query or only at server start/reload?
Regards, Clodoaldo Pinto Neto
* I didn't find this world at the dictionary but also didn't find
another one to say it.
| From: | Martijn van Oosterhout <kleptog(at)svana(dot)org> |
|---|---|
| To: | Clodoaldo <clodoaldo(dot)pinto(dot)neto(at)gmail(dot)com> |
| Cc: | Tom Lane <tgl(at)sss(dot)pgh(dot)pa(dot)us>, Scott Marlowe <scott(dot)marlowe(at)gmail(dot)com>, PostgreSQL - General ML <pgsql-general(at)postgresql(dot)org> |
| Subject: | Re: ATTN: Clodaldo was Performance problem. Could it be related to 8.3-beta4? |
| Date: | 2008-01-20 12:44:13 |
| Message-ID: | 20080120124413.GC9599@svana.org |
| Views: | Raw Message | Whole Thread | Download mbox | Resend email |
| Lists: | pgsql-general |
On Sun, Jan 20, 2008 at 09:29:16AM -0200, Clodoaldo wrote:
> Will "enable_hashagg" be settable(*) per query or only at server start/reload?
The enable_* settings are per session, so you can disable hashagg just
before the query and reenable it just after, or disable it for just
that process/user/database whatever you like.
I think the word you're looking for is "configurable".
Have a nice day,
--
Martijn van Oosterhout <kleptog(at)svana(dot)org> http://svana.org/kleptog/
> Those who make peaceful revolution impossible will make violent revolution inevitable.
> -- John F Kennedy
| From: | "Scott Marlowe" <scott(dot)marlowe(at)gmail(dot)com> |
|---|---|
| To: | "Martijn van Oosterhout" <kleptog(at)svana(dot)org>, Clodoaldo <clodoaldo(dot)pinto(dot)neto(at)gmail(dot)com>, "Tom Lane" <tgl(at)sss(dot)pgh(dot)pa(dot)us>, "Scott Marlowe" <scott(dot)marlowe(at)gmail(dot)com>, "PostgreSQL - General ML" <pgsql-general(at)postgresql(dot)org> |
| Subject: | Re: ATTN: Clodaldo was Performance problem. Could it be related to 8.3-beta4? |
| Date: | 2008-01-20 13:32:39 |
| Message-ID: | dcc563d10801200532o4bc1d075w1dff8d68c9e04ffd@mail.gmail.com |
| Views: | Raw Message | Whole Thread | Download mbox | Resend email |
| Lists: | pgsql-general |
On Jan 20, 2008 6:44 AM, Martijn van Oosterhout <kleptog(at)svana(dot)org> wrote:
> On Sun, Jan 20, 2008 at 09:29:16AM -0200, Clodoaldo wrote:
> > Will "enable_hashagg" be settable(*) per query or only at server start/reload?
>
> The enable_* settings are per session, so you can disable hashagg just
> before the query and reenable it just after, or disable it for just
> that process/user/database whatever you like.
>
> I think the word you're looking for is "configurable".
And don't forget
alter {user|database} xyz set enable_hashagg={on|off};
| From: | Alvaro Herrera <alvherre(at)commandprompt(dot)com> |
|---|---|
| To: | Tom Lane <tgl(at)sss(dot)pgh(dot)pa(dot)us> |
| Cc: | Clodoaldo <clodoaldo(dot)pinto(dot)neto(at)gmail(dot)com>, Scott Marlowe <scott(dot)marlowe(at)gmail(dot)com>, PostgreSQL - General ML <pgsql-general(at)postgresql(dot)org> |
| Subject: | Re: ATTN: Clodaldo was Performance problem. Could it be related to 8.3-beta4? |
| Date: | 2008-01-20 16:16:29 |
| Message-ID: | 20080120161629.GA22106@alvh.no-ip.org |
| Views: | Raw Message | Whole Thread | Download mbox | Resend email |
| Lists: | pgsql-general |
Tom Lane escribió:
> In the long run, for queries inserting many rows it might be interesting
> to accumulate all the entries intended for a btree index and sort them
> before inserting. Not sure about possible downsides of that.
Yeah, in the long run we need a more flexible approach towards index
insertion. I doubt we want to know _all_ the entries beforehand; that
would probably involve disk-spilling, etc. Perhaps accumulate a
reasonable number (using up to work_mem?) and insert those in batches.
--
Alvaro Herrera http://www.CommandPrompt.com/
The PostgreSQL Company - Command Prompt, Inc.
| From: | Tom Lane <tgl(at)sss(dot)pgh(dot)pa(dot)us> |
|---|---|
| To: | Russell Smith <mr-russ(at)pws(dot)com(dot)au> |
| Cc: | PostgreSQL - General ML <pgsql-general(at)postgresql(dot)org>, clodoaldo(dot)pinto(dot)neto(at)gmail(dot)com |
| Subject: | Re: ATTN: Clodaldo was Performance problem. Could it be related to 8.3-beta4? |
| Date: | 2008-01-20 18:05:27 |
| Message-ID: | 10135.1200852327@sss.pgh.pa.us |
| Views: | Raw Message | Whole Thread | Download mbox | Resend email |
| Lists: | pgsql-general |
Russell Smith <mr-russ(at)pws(dot)com(dot)au> writes:
> Tom Lane wrote:
>> A possibly usable workaround for now is "set enable_hashagg = off"
>> to force a GroupAggregate plan, which will deliver the values sorted
>> by (data, usuario) rather than by their hash values.
> If you add ORDER BY to the query, do you get different results?
Yeah, that should have the same effect. An advantage is that you don't
risk clobbering the performance of other queries by mistakenly leaving
hashagg turned off.
regards, tom lane
| From: | Tom Lane <tgl(at)sss(dot)pgh(dot)pa(dot)us> |
|---|---|
| To: | Martijn van Oosterhout <kleptog(at)svana(dot)org> |
| Cc: | Clodoaldo <clodoaldo(dot)pinto(dot)neto(at)gmail(dot)com>, Scott Marlowe <scott(dot)marlowe(at)gmail(dot)com>, PostgreSQL - General ML <pgsql-general(at)postgresql(dot)org> |
| Subject: | Re: ATTN: Clodaldo was Performance problem. Could it be related to 8.3-beta4? |
| Date: | 2008-01-20 18:13:37 |
| Message-ID: | 10231.1200852817@sss.pgh.pa.us |
| Views: | Raw Message | Whole Thread | Download mbox | Resend email |
| Lists: | pgsql-general |
Martijn van Oosterhout <kleptog(at)svana(dot)org> writes:
> A random thought: Is there not some way of representing this difference
> in the planner?
It's not so much that we have no way to represent the ordering, as that
the planner currently doesn't have any place in its conceptual model for
costs incurred outside the "plan tree". In this example we consider
only the costs of the SELECT part, not costs of inserting the resulting
rows someplace. Up to now we've always assumed that such costs could be
ignored because they'd be about the same for every valid plan for a
given query. This is the first example I can remember seeing in which
(a) that is not true, and (b) the effect might conceivably be within the
planner's ability to estimate costs for.
regards, tom lane
| From: | Tom Lane <tgl(at)sss(dot)pgh(dot)pa(dot)us> |
|---|---|
| To: | Alvaro Herrera <alvherre(at)commandprompt(dot)com> |
| Cc: | Clodoaldo <clodoaldo(dot)pinto(dot)neto(at)gmail(dot)com>, Scott Marlowe <scott(dot)marlowe(at)gmail(dot)com>, PostgreSQL - General ML <pgsql-general(at)postgresql(dot)org> |
| Subject: | Re: ATTN: Clodaldo was Performance problem. Could it be related to 8.3-beta4? |
| Date: | 2008-01-20 18:20:01 |
| Message-ID: | 10297.1200853201@sss.pgh.pa.us |
| Views: | Raw Message | Whole Thread | Download mbox | Resend email |
| Lists: | pgsql-general |
Alvaro Herrera <alvherre(at)commandprompt(dot)com> writes:
> Tom Lane escribi:
>> In the long run, for queries inserting many rows it might be interesting
>> to accumulate all the entries intended for a btree index and sort them
>> before inserting. Not sure about possible downsides of that.
> Yeah, in the long run we need a more flexible approach towards index
> insertion. I doubt we want to know _all_ the entries beforehand; that
> would probably involve disk-spilling, etc. Perhaps accumulate a
> reasonable number (using up to work_mem?) and insert those in batches.
After sleeping on it, the main problem I can see is that it'd mean the
index is transiently invalid. As an example of the problem, it's always
been true in the past that a BEFORE INSERT trigger could "see" rows
already inserted by the calling command --- but if it chanced to try to
use an index with delayed insertions, it might not see them. You could
work around this if the indexscan code knew to go search in the list of
pending insertions, but that's pretty ugly and possibly slow too.
regards, tom lane
| From: | Bruce Momjian <bruce(at)momjian(dot)us> |
|---|---|
| To: | Tom Lane <tgl(at)sss(dot)pgh(dot)pa(dot)us> |
| Cc: | Clodoaldo <clodoaldo(dot)pinto(dot)neto(at)gmail(dot)com>, Scott Marlowe <scott(dot)marlowe(at)gmail(dot)com>, PostgreSQL - General ML <pgsql-general(at)postgresql(dot)org> |
| Subject: | Re: ATTN: Clodaldo was Performance problem. Could it be related to 8.3-beta4? |
| Date: | 2008-03-25 02:17:26 |
| Message-ID: | 200803250217.m2P2HQw19917@momjian.us |
| Views: | Raw Message | Whole Thread | Download mbox | Resend email |
| Lists: | pgsql-general |
Added to TODO:
* Consider sorting entries before inserting into btree index
http://archives.postgresql.org/pgsql-general/2008-01/msg01010.php
---------------------------------------------------------------------------
Tom Lane wrote:
> Clodoaldo <clodoaldo(dot)pinto(dot)neto(at)gmail(dot)com> writes:
> > 2008/1/16, Tom Lane <tgl(at)sss(dot)pgh(dot)pa(dot)us>:
> >> I don't know of any reason to think that insertion is slower in 8.3
> >> than it was in 8.2, and no one else has reported anything of the sort.
>
> > The old server reproduces the behavior of the new one.
>
> Okay, Clodoaldo kindly gave me access to his old server, and after
> nearly a full day of poking at it I think I've figured out what is going
> on. Recall that the problem query is
>
> insert into usuarios (
> data,
> usuario,
> pontos,
> wus
> )
> select
> (select data_serial from data_serial) as data,
> ui.usuario_serial as usuario,
> sum(pontos) as pontos,
> sum(wus) as wus
> from usuarios_temp as ut inner join usuarios_indice as ui
> on ut.usuario = ui.usuario_nome and ut.n_time = ui.n_time
> group by data, ui.usuario_serial
> ;
>
> for which both 8.2 and 8.3 select a plan along the lines of
>
> Subquery Scan "*SELECT*" (cost=318139.26..342283.02 rows=877955 width=20)
> -> HashAggregate (cost=318139.26..331308.58 rows=877955 width=12)
> InitPlan
> -> Seq Scan on data_serial (cost=0.00..1.01 rows=1 width=4)
> -> Merge Join (cost=101944.33..261142.53 rows=5699572 width=12)
> Merge Cond: ((ut.n_time = ui.n_time) AND ((ut.usuario)::text = "inner"."?column4?"))
> -> Index Scan using usuarios_temp_ndx on usuarios_temp ut (cost=0.00..55038.92 rows=883729 width=26)
> -> Sort (cost=101944.33..104139.22 rows=877955 width=22)
> Sort Key: ui.n_time, (ui.usuario_nome)::text
> -> Seq Scan on usuarios_indice ui (cost=0.00..15273.55 rows=877955 width=22)
>
> and the target table has non-unique indexes on "data" and "usuario"
> (which are both simple integer columns, no surprises there).
>
> I first tried running this query with "usuarios" initially empty, and
> both 8.2 and 8.3 did fine. However, in the real scenario that Clodoaldo
> is worried about, there's somewhere north of 135 million entries in
> "usuarios" to begin with, and in that case 8.3 falls off a cliff while
> 8.2 doesn't --- the INSERT query takes about 400 seconds in 8.2 while
> I gave up at 2h20m with 8.3. Why is that? Well, it turns out that 8.3
> is thrashing a lot harder than 8.2 is. Each index on "usuarios" is
> about 2.3GB (the same in both versions) and the server has only 2GB RAM,
> so it's not real surprising that the working set might be more than RAM;
> but why is 8.3 worse than 8.2?
>
> You can see from the query that it's inserting the same constant "data"
> value into every new row, and if I understand the context correctly this
> value will be higher than all prior entries in the "usuarios" table. So
> all the new entries in the "data" index are at the right-hand edge of
> the index, and only a fairly small footprint is being touched at any
> instant. strace'ing confirms that neither 8.2 nor 8.3 do much I/O at
> all on that index. It's the index on the "usuario" column that is
> thrashing.
>
> The difference comes from the fact that the HashAggregate step --- which
> is being done on hashing columns (data, usuario) --- is effectively
> reading out in hash-value order for usuario, meaning that that is the
> order in which we make index insertions. 8.2 had an extremely chintzy
> hash function for integers --- basically just return the negative of the
> integer value --- while 8.3 takes it seriously and produces a nicely
> randomized hash value. This means that the usuario values are returned
> in a relatively well ordered fashion in 8.2 and a nearly totally random
> one in 8.3. I captured the output of the SELECT in both 8.2 and 8.3;
> attached are plots showing the usuario values against row number. From
> this we can see that 8.2 has a working set that is a relatively small
> part of the index at any instant, whereas 8.3 has the entire index as
> working set ... and it doesn't fit into RAM. Ergo, lots of disk seek
> delays.
>
> I don't think we want to back off the improved hashing functions in 8.3
> --- in most scenarios they should lead to significantly better
> performance. But in this particular context they hurt.
>
> A possibly usable workaround for now is "set enable_hashagg = off"
> to force a GroupAggregate plan, which will deliver the values sorted
> by (data, usuario) rather than by their hash values. This helps both
> versions, bringing the runtime down to something like 250 seconds,
> because the index on usuario then has complete locality of access.
> Alternatively, doubling the server's RAM would probably make the problem
> go away (for awhile, until the index reaches 4GB).
>
> In the long run, for queries inserting many rows it might be interesting
> to accumulate all the entries intended for a btree index and sort them
> before inserting. Not sure about possible downsides of that.
>
> regards, tom lane
>
Content-Description: usuario82.png
[ image/png is not supported, skipping... ]
Content-Description: usuario83.png
[ image/png is not supported, skipping... ]
>
> ---------------------------(end of broadcast)---------------------------
> TIP 4: Have you searched our list archives?
>
> http://archives.postgresql.org/
--
Bruce Momjian <bruce(at)momjian(dot)us> http://momjian.us
EnterpriseDB http://postgres.enterprisedb.com
+ If your life is a hard drive, Christ can be your backup. +