Re: [PERFORM] Slow query: bitmap scan troubles
| Lists: | pgsql-hackerspgsql-performance |
|---|
| From: | <postgresql(at)foo(dot)me(dot)uk> |
|---|---|
| To: | <pgsql-performance(at)postgresql(dot)org> |
| Subject: | Slow query: bitmap scan troubles |
| Date: | 2012-12-04 15:06:48 |
| Message-ID: | 092a01cdd230$ff6143c0$fe23cb40$@foo.me.uk |
| Views: | Raw Message | Whole Thread | Download mbox | Resend email |
| Lists: | pgsql-hackers pgsql-performance |
Hi guys (and girls)
I've been banging my head over this for a few days now so if any of you kind
souls could take a minute to take a look at this I would be eternally
grateful.
I have a pretty straightforward query that is very slow by default, and
about 70 times faster when I set enable_bitmapscan=off. I would like to
convince the planner to use my lovely indexes.
The scenario is this; I have two tables, trade and position_effect. A trade
is a deal we do with somebody to exchange something for something else. It
has a time it was done, and is associated with a particular book for
accounting purposes. A position effect records changes to our position (e.g.
how much we have) of an particular asset. One trade can many position
effects (usually only 1,2 or 3)
For example, I do a trade of USD/GBP and I get two position effects, +1000
GBP and -1200USD
SCHEMA:
-------
The actual schema is a bit more complicated but I will put the important
parts here (if you think it important, the full schema for the two tables is
here: http://pastebin.com/6Y52aDFL):
CREATE TABLE trade
(
id bigserial NOT NULL,
time_executed timestamp with time zone NOT NULL,
id_book integer NOT NULL,
CONSTRAINT cons_trade_primary_key PRIMARY KEY (id),
)
CREATE INDEX idx_trade_id_book
ON trade
USING btree
(id_book, time_executed, id);
CREATE TABLE position_effect
(
id bigserial NOT NULL,
id_trade bigint NOT NULL,
id_asset integer NOT NULL,
quantity double precision NOT NULL,
CONSTRAINT cons_pe_primary_key PRIMARY KEY (id_trade, id_asset),
)
SETUP:
------
These tables are relatively large (~100 million rows in position effect).
The box is a pretty beastly affair with 512Mb of ram and 4x10 2Ghz cores.
The postgres configuration is here:
I am using a 64bit postgresql 9.2.1, hand compiled on a RedHat 6.2 box.
QUERY:
------
What I want to do is sum all of the position effects, for a particular asset
while joined to the trade table to filter for the time it was executed and
the book it was traded into:
SELECT sum(position_effect.quantity)
FROM trade, position_effect
WHERE trade.id = position_effect.id_trade
AND position_effect.id_asset = 1837
AND trade.time_executed >= '2012-10-28 00:00:00'
AND trade.id_book = 41
In this case there are only 11 rows that need to be summed. If I just let
postgres do its thing, that query takes 5000ms (Which when multiplied over
many books and assets gets very slow). I think this is because it is
bitmapping the whole position_effect table which is very large. If I disable
bitmap scans:
set enable_bitmapscan = off;
The query takes 43ms, and properly uses the indexes I have set up.
Slow version with bitmapscan enabled: http://explain.depesz.com/s/6I7
Fast version with bitmapscan disabled: http://explain.depesz.com/s/4MWG
| From: | <postgresql(at)foo(dot)me(dot)uk> |
|---|---|
| To: | <pgsql-performance(at)postgresql(dot)org> |
| Subject: | Re: Slow query: bitmap scan troubles |
| Date: | 2012-12-04 15:21:17 |
| Message-ID: | 093301cdd233$057a2b30$106e8190$@foo.me.uk |
| Views: | Raw Message | Whole Thread | Download mbox | Resend email |
| Lists: | pgsql-hackers pgsql-performance |
Bad form to reply to yourself I know but just check-reading that for the
third time I noticed two mistakes
- The box has 128Gb of ram, not 512Mb
- There is an additional constraint on the position_effect table (though I
don't think it matters for this discussion):
CONSTRAINT cons_pe_trade FOREIGN KEY (id_trade) REFERENCES trade (id)
Sorry to clog your inboxes further!
Regards,
Philip
-----Original Message-----
From: pgsql-performance-owner(at)postgresql(dot)org
[mailto:pgsql-performance-owner(at)postgresql(dot)org] On Behalf Of
postgresql(at)foo(dot)me(dot)uk
Sent: 04 December 2012 15:07
To: pgsql-performance(at)postgresql(dot)org
Subject: [PERFORM] Slow query: bitmap scan troubles
Hi guys (and girls)
I've been banging my head over this for a few days now so if any of you kind
souls could take a minute to take a look at this I would be eternally
grateful.
I have a pretty straightforward query that is very slow by default, and
about 70 times faster when I set enable_bitmapscan=off. I would like to
convince the planner to use my lovely indexes.
The scenario is this; I have two tables, trade and position_effect. A trade
is a deal we do with somebody to exchange something for something else. It
has a time it was done, and is associated with a particular book for
accounting purposes. A position effect records changes to our position (e.g.
how much we have) of an particular asset. One trade can many position
effects (usually only 1,2 or 3)
For example, I do a trade of USD/GBP and I get two position effects, +1000
GBP and -1200USD
SCHEMA:
-------
The actual schema is a bit more complicated but I will put the important
parts here (if you think it important, the full schema for the two tables is
here: http://pastebin.com/6Y52aDFL):
CREATE TABLE trade
(
id bigserial NOT NULL,
time_executed timestamp with time zone NOT NULL,
id_book integer NOT NULL,
CONSTRAINT cons_trade_primary_key PRIMARY KEY (id),
)
CREATE INDEX idx_trade_id_book
ON trade
USING btree
(id_book, time_executed, id);
CREATE TABLE position_effect
(
id bigserial NOT NULL,
id_trade bigint NOT NULL,
id_asset integer NOT NULL,
quantity double precision NOT NULL,
CONSTRAINT cons_pe_primary_key PRIMARY KEY (id_trade, id_asset),
)
SETUP:
------
These tables are relatively large (~100 million rows in position effect).
The box is a pretty beastly affair with 512Mb of ram and 4x10 2Ghz cores.
The postgres configuration is here:
I am using a 64bit postgresql 9.2.1, hand compiled on a RedHat 6.2 box.
QUERY:
------
What I want to do is sum all of the position effects, for a particular asset
while joined to the trade table to filter for the time it was executed and
the book it was traded into:
SELECT sum(position_effect.quantity)
FROM trade, position_effect
WHERE trade.id = position_effect.id_trade
AND position_effect.id_asset = 1837
AND trade.time_executed >= '2012-10-28 00:00:00'
AND trade.id_book = 41
In this case there are only 11 rows that need to be summed. If I just let
postgres do its thing, that query takes 5000ms (Which when multiplied over
many books and assets gets very slow). I think this is because it is
bitmapping the whole position_effect table which is very large. If I disable
bitmap scans:
set enable_bitmapscan = off;
The query takes 43ms, and properly uses the indexes I have set up.
Slow version with bitmapscan enabled: http://explain.depesz.com/s/6I7 Fast
version with bitmapscan disabled: http://explain.depesz.com/s/4MWG
--
Sent via pgsql-performance mailing list (pgsql-performance(at)postgresql(dot)org)
To make changes to your subscription:
http://www.postgresql.org/mailpref/pgsql-performance
| From: | Claudio Freire <klaussfreire(at)gmail(dot)com> |
|---|---|
| To: | postgresql(at)foo(dot)me(dot)uk |
| Cc: | postgres performance list <pgsql-performance(at)postgresql(dot)org> |
| Subject: | Re: Slow query: bitmap scan troubles |
| Date: | 2012-12-04 15:27:57 |
| Message-ID: | CAGTBQpaKOfZs+qy+S7CCPcTg7PYOrwgcQAXgWV88cQTn-BFstg@mail.gmail.com |
| Views: | Raw Message | Whole Thread | Download mbox | Resend email |
| Lists: | pgsql-hackers pgsql-performance |
On Tue, Dec 4, 2012 at 12:06 PM, <postgresql(at)foo(dot)me(dot)uk> wrote:
> Slow version with bitmapscan enabled: http://explain.depesz.com/s/6I7
> Fast version with bitmapscan disabled: http://explain.depesz.com/s/4MWG
If you check the "fast" plan, it has a higher cost compared against
the "slow" plan.
The difference between cost estimation and actual cost of your
queries, under relatively precise row estimates, seems to suggest your
e_c_s or r_p_c aren't a reflection of your hardware's performance.
First, make sure caching isn't interfering with your results. Run each
query several times.
Then, if the difference persists, you may have to tweak
effective_cache_size first, maybe random_page_cost too, to better
match your I/O subsystem's actual performance
| From: | Jeff Janes <jeff(dot)janes(at)gmail(dot)com> |
|---|---|
| To: | Claudio Freire <klaussfreire(at)gmail(dot)com> |
| Cc: | postgresql(at)foo(dot)me(dot)uk, postgres performance list <pgsql-performance(at)postgresql(dot)org> |
| Subject: | Re: Slow query: bitmap scan troubles |
| Date: | 2012-12-04 17:22:29 |
| Message-ID: | CAMkU=1wEc1cCeUdR1oZ3Q2fe2pGj6tvrwRcY2obbfEk8LcNypQ@mail.gmail.com |
| Views: | Raw Message | Whole Thread | Download mbox | Resend email |
| Lists: | pgsql-hackers pgsql-performance |
On Tue, Dec 4, 2012 at 7:27 AM, Claudio Freire <klaussfreire(at)gmail(dot)com> wrote:
> On Tue, Dec 4, 2012 at 12:06 PM, <postgresql(at)foo(dot)me(dot)uk> wrote:
>> Slow version with bitmapscan enabled: http://explain.depesz.com/s/6I7
>> Fast version with bitmapscan disabled: http://explain.depesz.com/s/4MWG
>
> If you check the "fast" plan, it has a higher cost compared against
> the "slow" plan.
>
> The difference between cost estimation and actual cost of your
> queries, under relatively precise row estimates, seems to suggest your
> e_c_s or r_p_c aren't a reflection of your hardware's performance.
But the row estimates are not precise at the top of the join/filter.
It thinks there will 2120 rows, but there are only 11.
So it seems like there is a negative correlation between the two
tables which is not recognized.
> First, make sure caching isn't interfering with your results. Run each
> query several times.
If that is not how the production system works (running the same query
over and over) then you want to model the cold cache, not the hot one.
But in any case, the posted explains indicates that all buffers were
cached.
Cheers,
Jeff
| From: | Claudio Freire <klaussfreire(at)gmail(dot)com> |
|---|---|
| To: | Jeff Janes <jeff(dot)janes(at)gmail(dot)com> |
| Cc: | postgresql(at)foo(dot)me(dot)uk, postgres performance list <pgsql-performance(at)postgresql(dot)org> |
| Subject: | Re: Slow query: bitmap scan troubles |
| Date: | 2012-12-04 17:25:56 |
| Message-ID: | CAGTBQpbqzBf5545-qxdLQHbLyBBOvxn3hEtjQmqEp+UJPKsSrA@mail.gmail.com |
| Views: | Raw Message | Whole Thread | Download mbox | Resend email |
| Lists: | pgsql-hackers pgsql-performance |
On Tue, Dec 4, 2012 at 2:22 PM, Jeff Janes <jeff(dot)janes(at)gmail(dot)com> wrote:
> On Tue, Dec 4, 2012 at 7:27 AM, Claudio Freire <klaussfreire(at)gmail(dot)com> wrote:
>> On Tue, Dec 4, 2012 at 12:06 PM, <postgresql(at)foo(dot)me(dot)uk> wrote:
>>> Slow version with bitmapscan enabled: http://explain.depesz.com/s/6I7
>>> Fast version with bitmapscan disabled: http://explain.depesz.com/s/4MWG
>>
>> If you check the "fast" plan, it has a higher cost compared against
>> the "slow" plan.
>>
>> The difference between cost estimation and actual cost of your
>> queries, under relatively precise row estimates, seems to suggest your
>> e_c_s or r_p_c aren't a reflection of your hardware's performance.
>
> But the row estimates are not precise at the top of the join/filter.
> It thinks there will 2120 rows, but there are only 11.
Ah... I didn't spot that one...
| From: | "Philip Scott" <pscott(at)foo(dot)me(dot)uk> |
|---|---|
| To: | "'postgres performance list'" <pgsql-performance(at)postgresql(dot)org> |
| Subject: | Re: Slow query: bitmap scan troubles |
| Date: | 2012-12-04 17:35:32 |
| Message-ID: | 096a01cdd245$c4a49830$4dedc890$@foo.me.uk |
| Views: | Raw Message | Whole Thread | Download mbox | Resend email |
| Lists: | pgsql-hackers pgsql-performance |
>> But the row estimates are not precise at the top of the join/filter.
>> It thinks there will 2120 rows, but there are only 11.
>Ah... I didn't spot that one...
Yes, you are right there - this is probably a slightly atypical query of
this sort actually, 2012 is a pretty good guess.
On Claudio's suggestion I have found lots more things to read up on and am
eagerly awaiting 6pm when I can bring the DB down and start tweaking. The
effective_work_mem setting is going from 6Gb->88Gb which I think will make
quite a difference.
I still can't quite wrap around my head why accessing an index is expected
to use more disk access than doing a bitmap scan of the table itself, but I
guess it does make a bit of sense if postgres assumes the table is more
likely to be cached.
It's all quite, quite fascinating :)
I'll let you know how it goes.
- Phil
| From: | <postgresql(at)foo(dot)me(dot)uk> |
|---|---|
| To: | "'postgres performance list'" <pgsql-performance(at)postgresql(dot)org> |
| Subject: | Re: Slow query: bitmap scan troubles |
| Date: | 2012-12-04 17:47:29 |
| Message-ID: | 096f01cdd247$722264a0$56672de0$@foo.me.uk |
| Views: | Raw Message | Whole Thread | Download mbox | Resend email |
| Lists: | pgsql-hackers pgsql-performance |
>> But the row estimates are not precise at the top of the join/filter.
>> It thinks there will 2120 rows, but there are only 11.
>Ah... I didn't spot that one...
Yes, you are right there - this is probably a slightly atypical query of
this sort actually, 2012 is a pretty good guess.
On Claudio's suggestion I have found lots more things to read up on and am
eagerly awaiting 6pm when I can bring the DB down and start tweaking. The
effective_work_mem setting is going from 6Gb->88Gb which I think will make
quite a difference.
I still can't quite wrap around my head why accessing an index is expected
to use more disk access than doing a bitmap scan of the table itself, but I
guess it does make a bit of sense if postgres assumes the table is more
likely to be cached.
It's all quite, quite fascinating :)
I'll let you know how it goes.
- Phil
| From: | <postgresql(at)foo(dot)me(dot)uk> |
|---|---|
| To: | "'postgres performance list'" <pgsql-performance(at)postgresql(dot)org> |
| Subject: | Re: Slow query: bitmap scan troubles |
| Date: | 2012-12-04 18:03:29 |
| Message-ID: | 097601cdd249$ae338530$0a9a8f90$@foo.me.uk |
| Views: | Raw Message | Whole Thread | Download mbox | Resend email |
| Lists: | pgsql-hackers pgsql-performance |
> But the row estimates are not precise at the top of the join/filter.
> It thinks there will 2120 rows, but there are only 11.
> So it seems like there is a negative correlation between the two tables
which is not recognized.
Yes, you are right there. I am only just beginning to understand how to
parse these explain reports.. As I mentioned above, I probably picked a bad
example to run that query on 11 is an unusually low number of results to get
back, a few thousand would be more normal.
Though that doesn't account for the 70x difference between the speed of the
two queries in actuality given a pretty similar expected speed (does it?).
It does go some way to explaining why a bad choice of plan was made.
Is there some nice bit of literature somewhere that explains what sort of
costs are associated with the different types of lookup? I have found bits
and bobs online but I still don't have a really clear idea in my head what
the difference is between a bitmap index scan and index only scan is, though
I can sort of guess I don't see why one would be considered more likely to
use the disk than the other.
On the 'slow' query (with the better predicted score)
>> First, make sure caching isn't interfering with your results. Run each
>> query several times.
> If that is not how the production system works (running the same query
over and over) then you want to model the cold cache, not the hot one.
> But in any case, the posted explains indicates that all buffers were
cached.
We are in the rather pleasant situation here in that we are willing to spend
money on the box (up to a point, but quite a large point) to get it up to
the spec so that it should hardly ever need to touch the disk, the trick is
figuring out how to let our favourite database server know that.
I've just discovered pgtune and am having some fun with that too.
Cheers,
Phil
| From: | "Philip Scott" <pscott(at)foo(dot)me(dot)uk> |
|---|---|
| To: | "'Claudio Freire'" <klaussfreire(at)gmail(dot)com>, <postgresql(at)foo(dot)me(dot)uk> |
| Cc: | "'postgres performance list'" <pgsql-performance(at)postgresql(dot)org> |
| Subject: | Re: Slow query: bitmap scan troubles |
| Date: | 2012-12-04 18:31:05 |
| Message-ID: | 098101cdd24d$892524c0$9b6f6e40$@foo.me.uk |
| Views: | Raw Message | Whole Thread | Download mbox | Resend email |
| Lists: | pgsql-hackers pgsql-performance |
> The difference between cost estimation and actual cost of your queries,
under relatively precise row estimates, seems to suggest your e_c_s or r_p_c
aren't a reflection of your hardware's performance.
Wow, so tweaking these has fixed it and then some. It now picks a slightly
different plan than the 'fast' one previously:
New super fast version with e_c_s 6GB->88Gb and r_p_c 2-> 1 (s_p_c 1->0.5):
http://explain.depesz.com/s/ECk
For reference:
> Slow version with bitmapscan enabled: http://explain.depesz.com/s/6I7
> Fast version with bitmapscan disabled: http://explain.depesz.com/s/4MWG
| From: | Claudio Freire <klaussfreire(at)gmail(dot)com> |
|---|---|
| To: | postgresql(at)foo(dot)me(dot)uk |
| Cc: | postgres performance list <pgsql-performance(at)postgresql(dot)org> |
| Subject: | Re: Slow query: bitmap scan troubles |
| Date: | 2012-12-04 18:31:50 |
| Message-ID: | CAGTBQpaueZhezPjfM8Vaw1UExeYJh6jR6+6S0Qk_k59Bb5m=MQ@mail.gmail.com |
| Views: | Raw Message | Whole Thread | Download mbox | Resend email |
| Lists: | pgsql-hackers pgsql-performance |
On Tue, Dec 4, 2012 at 3:03 PM, <postgresql(at)foo(dot)me(dot)uk> wrote:
>
> Though that doesn't account for the 70x difference between the speed of the
> two queries in actuality given a pretty similar expected speed (does it?).
> It does go some way to explaining why a bad choice of plan was made.
I still don't think it does. I still think the problem is the GUC settings.
The slow plan joins in a way that processes all 3M rows in both sides
of the join, and pg knows it.
The fast plan only processes 5k of them. And pg knows it. Why is it
choosing to process 3M rows?
If there's negative correlation, it only means less rows will be
produced, but the nested loop and and the right-hand index scan still
happens.
| From: | Claudio Freire <klaussfreire(at)gmail(dot)com> |
|---|---|
| To: | Philip Scott <pscott(at)foo(dot)me(dot)uk> |
| Cc: | postgresql(at)foo(dot)me(dot)uk, postgres performance list <pgsql-performance(at)postgresql(dot)org> |
| Subject: | Re: Slow query: bitmap scan troubles |
| Date: | 2012-12-04 18:32:57 |
| Message-ID: | CAGTBQpb2FZfbhLD_vwUJfNja-KHHypJ6zXrOPjsUwn0+prvtcA@mail.gmail.com |
| Views: | Raw Message | Whole Thread | Download mbox | Resend email |
| Lists: | pgsql-hackers pgsql-performance |
On Tue, Dec 4, 2012 at 3:31 PM, Philip Scott <pscott(at)foo(dot)me(dot)uk> wrote:
> r_p_c 2-> 1 (s_p_c 1->0.5):
Is this really necessary?
(looks like a no-op, unless your CPU is slow)
| From: | Vitalii Tymchyshyn <tivv00(at)gmail(dot)com> |
|---|---|
| To: | postgresql(at)foo(dot)me(dot)uk |
| Cc: | postgres performance list <pgsql-performance(at)postgresql(dot)org> |
| Subject: | Re: Slow query: bitmap scan troubles |
| Date: | 2012-12-04 18:50:41 |
| Message-ID: | CABWW-d2gK6=AOBWxJij8GYS6CQC4+p7xWDsr4FSs2-BaXDQMsA@mail.gmail.com |
| Views: | Raw Message | Whole Thread | Download mbox | Resend email |
| Lists: | pgsql-hackers pgsql-performance |
Well, you don't need to put anything down. Most settings that change
planner decisions can be tuned on per-quey basis by issuing set commands in
given session. This should not affect other queries more than it is needed
to run query in the way planner chooses.
Best regards, Vitalii Tymchyshyn
2012/12/4 <postgresql(at)foo(dot)me(dot)uk>
>
> >> But the row estimates are not precise at the top of the join/filter.
> >> It thinks there will 2120 rows, but there are only 11.
>
> >Ah... I didn't spot that one...
>
> Yes, you are right there - this is probably a slightly atypical query of
> this sort actually, 2012 is a pretty good guess.
>
> On Claudio's suggestion I have found lots more things to read up on and am
> eagerly awaiting 6pm when I can bring the DB down and start tweaking. The
> effective_work_mem setting is going from 6Gb->88Gb which I think will make
> quite a difference.
>
> I still can't quite wrap around my head why accessing an index is expected
> to use more disk access than doing a bitmap scan of the table itself, but I
> guess it does make a bit of sense if postgres assumes the table is more
> likely to be cached.
>
> It's all quite, quite fascinating :)
>
> I'll let you know how it goes.
>
> - Phil
>
>
>
> --
> Sent via pgsql-performance mailing list (pgsql-performance(at)postgresql(dot)org)
> To make changes to your subscription:
> http://www.postgresql.org/mailpref/pgsql-performance
>
--
Best regards,
Vitalii Tymchyshyn
| From: | <postgresql(at)foo(dot)me(dot)uk> |
|---|---|
| To: | "'postgres performance list'" <pgsql-performance(at)postgresql(dot)org> |
| Subject: | Re: Slow query: bitmap scan troubles |
| Date: | 2012-12-04 18:54:29 |
| Message-ID: | 098601cdd250$ce2f85d0$6a8e9170$@foo.me.uk |
| Views: | Raw Message | Whole Thread | Download mbox | Resend email |
| Lists: | pgsql-hackers pgsql-performance |
Ah, okay - my reasoning was there's a big fancy-pants raid array behind it
that makes disk operations faster relative to CPU ones.
I'll test it and see if it actually makes any difference.
-----Original Message-----
From: Claudio Freire [mailto:klaussfreire(at)gmail(dot)com]
Sent: 04 December 2012 18:33
To: Philip Scott
Cc: postgresql(at)foo(dot)me(dot)uk; postgres performance list
Subject: Re: [PERFORM] Slow query: bitmap scan troubles
On Tue, Dec 4, 2012 at 3:31 PM, Philip Scott <pscott(at)foo(dot)me(dot)uk> wrote:
> r_p_c 2-> 1 (s_p_c 1->0.5):
Is this really necessary?
(looks like a no-op, unless your CPU is slow)
| From: | "Philip Scott" <pscott(at)foo(dot)me(dot)uk> |
|---|---|
| To: | "'Vitalii Tymchyshyn'" <tivv00(at)gmail(dot)com>, <postgresql(at)foo(dot)me(dot)uk> |
| Cc: | "'postgres performance list'" <pgsql-performance(at)postgresql(dot)org> |
| Subject: | Re: Slow query: bitmap scan troubles |
| Date: | 2012-12-04 18:55:17 |
| Message-ID: | 098801cdd250$e70232b0$b5069810$@foo.me.uk |
| Views: | Raw Message | Whole Thread | Download mbox | Resend email |
| Lists: | pgsql-hackers pgsql-performance |
Ah okay, thanks. I knew I could set various things but not
effective_work_mem (I tried reloading the edited config file but it didn't
seem to pick it up)
From: Vitalii Tymchyshyn [mailto:tivv00(at)gmail(dot)com]
Sent: 04 December 2012 18:51
To: postgresql(at)foo(dot)me(dot)uk
Cc: postgres performance list
Subject: Re: [PERFORM] Slow query: bitmap scan troubles
Well, you don't need to put anything down. Most settings that change planner
decisions can be tuned on per-quey basis by issuing set commands in given
session. This should not affect other queries more than it is needed to run
query in the way planner chooses.
Best regards, Vitalii Tymchyshyn
2012/12/4 <postgresql(at)foo(dot)me(dot)uk>
>> But the row estimates are not precise at the top of the join/filter.
>> It thinks there will 2120 rows, but there are only 11.
>Ah... I didn't spot that one...
Yes, you are right there - this is probably a slightly atypical query of
this sort actually, 2012 is a pretty good guess.
On Claudio's suggestion I have found lots more things to read up on and am
eagerly awaiting 6pm when I can bring the DB down and start tweaking. The
effective_work_mem setting is going from 6Gb->88Gb which I think will make
quite a difference.
I still can't quite wrap around my head why accessing an index is expected
to use more disk access than doing a bitmap scan of the table itself, but I
guess it does make a bit of sense if postgres assumes the table is more
likely to be cached.
It's all quite, quite fascinating :)
I'll let you know how it goes.
- Phil
--
Sent via pgsql-performance mailing list (pgsql-performance(at)postgresql(dot)org)
To make changes to your subscription:
http://www.postgresql.org/mailpref/pgsql-performance
--
Best regards,
Vitalii Tymchyshyn
| From: | <postgresql(at)foo(dot)me(dot)uk> |
|---|---|
| To: | "'postgres performance list'" <pgsql-performance(at)postgresql(dot)org> |
| Subject: | Re: Slow query: bitmap scan troubles |
| Date: | 2012-12-04 18:56:04 |
| Message-ID: | 099801cdd251$02c7b9c0$08572d40$@foo.me.uk |
| Views: | Raw Message | Whole Thread | Download mbox | Resend email |
| Lists: | pgsql-hackers pgsql-performance |
Ah okay, thanks. I knew I could set various things but not
effective_work_mem (I tried reloading the edited config file but it didn't
seem to pick it up)
From: Vitalii Tymchyshyn [mailto:tivv00(at)gmail(dot)com]
Sent: 04 December 2012 18:51
To: postgresql(at)foo(dot)me(dot)uk
Cc: postgres performance list
Subject: Re: [PERFORM] Slow query: bitmap scan troubles
Well, you don't need to put anything down. Most settings that change planner
decisions can be tuned on per-quey basis by issuing set commands in given
session. This should not affect other queries more than it is needed to run
query in the way planner chooses.
Best regards, Vitalii Tymchyshyn
2012/12/4 <postgresql(at)foo(dot)me(dot)uk>
>> But the row estimates are not precise at the top of the join/filter.
>> It thinks there will 2120 rows, but there are only 11.
>Ah... I didn't spot that one...
Yes, you are right there - this is probably a slightly atypical query of
this sort actually, 2012 is a pretty good guess.
On Claudio's suggestion I have found lots more things to read up on and am
eagerly awaiting 6pm when I can bring the DB down and start tweaking. The
effective_work_mem setting is going from 6Gb->88Gb which I think will make
quite a difference.
I still can't quite wrap around my head why accessing an index is expected
to use more disk access than doing a bitmap scan of the table itself, but I
guess it does make a bit of sense if postgres assumes the table is more
likely to be cached.
It's all quite, quite fascinating :)
I'll let you know how it goes.
- Phil
--
Sent via pgsql-performance mailing list (pgsql-performance(at)postgresql(dot)org)
To make changes to your subscription:
http://www.postgresql.org/mailpref/pgsql-performance
--
Best regards,
Vitalii Tymchyshyn
| From: | Sergey Konoplev <gray(dot)ru(at)gmail(dot)com> |
|---|---|
| To: | postgresql(at)foo(dot)me(dot)uk |
| Cc: | postgres performance list <pgsql-performance(at)postgresql(dot)org> |
| Subject: | Re: Slow query: bitmap scan troubles |
| Date: | 2012-12-04 20:11:53 |
| Message-ID: | CAL_0b1vkyXYYpCxbFvu-4Piem10Y-tPz50MRO-mp3QMbkF1mEQ@mail.gmail.com |
| Views: | Raw Message | Whole Thread | Download mbox | Resend email |
| Lists: | pgsql-hackers pgsql-performance |
On Tue, Dec 4, 2012 at 9:47 AM, <postgresql(at)foo(dot)me(dot)uk> wrote:
> eagerly awaiting 6pm when I can bring the DB down and start tweaking. The
> effective_work_mem setting is going from 6Gb->88Gb which I think will make
> quite a difference.
I also wonder if increasing (say x10) of default_statistics_target or
just doing ALTER TABLE SET STATISTICS for particular tables will help.
It will make planned to produce more precise estimations. Do not
forget ANALYZE afer changing it.
>
> I still can't quite wrap around my head why accessing an index is expected
> to use more disk access than doing a bitmap scan of the table itself, but I
> guess it does make a bit of sense if postgres assumes the table is more
> likely to be cached.
>
> It's all quite, quite fascinating :)
>
> I'll let you know how it goes.
>
> - Phil
>
>
>
> --
> Sent via pgsql-performance mailing list (pgsql-performance(at)postgresql(dot)org)
> To make changes to your subscription:
> http://www.postgresql.org/mailpref/pgsql-performance
--
Sergey Konoplev
Database and Software Architect
http://www.linkedin.com/in/grayhemp
Phones:
USA +1 415 867 9984
Russia, Moscow +7 901 903 0499
Russia, Krasnodar +7 988 888 1979
Skype: gray-hemp
Jabber: gray(dot)ru(at)gmail(dot)com
| From: | Jeff Janes <jeff(dot)janes(at)gmail(dot)com> |
|---|---|
| To: | postgresql(at)foo(dot)me(dot)uk |
| Cc: | postgres performance list <pgsql-performance(at)postgresql(dot)org> |
| Subject: | Re: Slow query: bitmap scan troubles |
| Date: | 2012-12-04 22:34:42 |
| Message-ID: | CAMkU=1zCDqsnfQ-cE4jc_A8=WhJYkDGwMh1-V8vB4a8fQ60ysA@mail.gmail.com |
| Views: | Raw Message | Whole Thread | Download mbox | Resend email |
| Lists: | pgsql-hackers pgsql-performance |
On Tue, Dec 4, 2012 at 9:47 AM, <postgresql(at)foo(dot)me(dot)uk> wrote:
>
>>> But the row estimates are not precise at the top of the join/filter.
>>> It thinks there will 2120 rows, but there are only 11.
>
>>Ah... I didn't spot that one...
>
> Yes, you are right there - this is probably a slightly atypical query of
> this sort actually, 2012 is a pretty good guess.
What do the timings look like on a more realistic example?
> On Claudio's suggestion I have found lots more things to read up on and am
> eagerly awaiting 6pm when I can bring the DB down and start tweaking. The
> effective_work_mem setting is going from 6Gb->88Gb which I think will make
> quite a difference.
You can change effective_cache_size just in your own session, or do it
globally with a "reload" or SIGHUP, no need to bring down the server.
However, I don't think it will make much difference. Even though it
thinks it is hitting the index 14,085 times, that is still small
compared to the overall size of the table.
> I still can't quite wrap around my head why accessing an index is expected
> to use more disk access than doing a bitmap scan of the table itself,
It is only doing an bitmap scan of those parts of the table which
contain relevant data, and it is doing them in physical order, so it
thinks that much of the IO which it thinks it is going to do is
largely sequential.
> but I
> guess it does make a bit of sense if postgres assumes the table is more
> likely to be cached.
Unfortunately, postgres's planner doesn't know anything about that.
From your "explain" I can see in hindsight that everything you needed
was cached, but that is not information that the planner can use
(currently). And I don't know if *everything* is cached, or if just
those particular blocks are because you already ran the same query
with the same parameters recently.
Also, your work_mem is pretty low given the amount of RAM you have.
work_mem = 1MB
I don't think the current planner attempts to take account of the fact
that a bitmap scan which overflows work_mem and so becomes "lossy" is
quite a performance set-back. Nor does it look like explain analyze
informs you of this happening. But maybe I'm just looking in the
wrong places.
Cheers,
Jeff
| From: | Jeff Janes <jeff(dot)janes(at)gmail(dot)com> |
|---|---|
| To: | postgresql(at)foo(dot)me(dot)uk |
| Cc: | postgres performance list <pgsql-performance(at)postgresql(dot)org> |
| Subject: | Re: Slow query: bitmap scan troubles |
| Date: | 2012-12-04 23:42:21 |
| Message-ID: | CAMkU=1wmxKifgUufbSffQ+VH3kFNczK65MxXetwVFJZd3zvkeA@mail.gmail.com |
| Views: | Raw Message | Whole Thread | Download mbox | Resend email |
| Lists: | pgsql-hackers pgsql-performance |
On Tue, Dec 4, 2012 at 10:03 AM, <postgresql(at)foo(dot)me(dot)uk> wrote:
>
> Though that doesn't account for the 70x difference between the speed of the
> two queries in actuality given a pretty similar expected speed (does it?).
It kind of does. The expected speed is predicated on the number of
rows being 200 fold higher. If the number of rows actually was that
much higher, the two speeds might be closer together. That is why it
would be interesting to see a more typical case where the actual
number of rows is closer to the 2000 estimate.
But I am curious about how the cost estimate for the primary key look
up is arrived at:
Index Scan using cons_pe_primary_key on position_effect
(cost=0.00..42.96 rows=1 width=16)
There should be a random page for the index leaf page, and a random
page for the heap page. Since you set random_page_cost to 2, that
comes up to 4. Then there would be some almost negligible CPU costs.
Where the heck is the extra 38 cost coming from?
> It does go some way to explaining why a bad choice of plan was made.
>
> Is there some nice bit of literature somewhere that explains what sort of
> costs are associated with the different types of lookup?
I've heard good things about Greg Smith's book, but I don't know if it
covers this particular thing.
Otherwise, I don't know of a good single place which is a tutorial
rather than a reference (or the code itself)
>>> First, make sure caching isn't interfering with your results. Run each
>>> query several times.
>> If that is not how the production system works (running the same query
> over and over) then you want to model the cold cache, not the hot one.
>> But in any case, the posted explains indicates that all buffers were
> cached.
>
> We are in the rather pleasant situation here in that we are willing to spend
> money on the box (up to a point, but quite a large point) to get it up to
> the spec so that it should hardly ever need to touch the disk, the trick is
> figuring out how to let our favourite database server know that.
Well, that part is fairly easy. Make random_page_cost and
seq_page_cost much smaller than their defaults. Like, 0.04 and 0.03,
for example.
I think the *_page_cost should strictly an estimate of actually doing
IO, with a separate parameter to reflect likelihood of needing to do
the IO, like *_page_cachedness. But that isn't the way it is done
currently.
Cheers,
Jeff
| From: | Jeff Janes <jeff(dot)janes(at)gmail(dot)com> |
|---|---|
| To: | postgresql(at)foo(dot)me(dot)uk |
| Cc: | postgres performance list <pgsql-performance(at)postgresql(dot)org> |
| Subject: | Re: Slow query: bitmap scan troubles |
| Date: | 2012-12-05 17:39:35 |
| Message-ID: | CAMkU=1w40aQt0twukCsvL2hPHUPujLqJBe8v90phuqBJ5wgw1Q@mail.gmail.com |
| Views: | Raw Message | Whole Thread | Download mbox | Resend email |
| Lists: | pgsql-hackers pgsql-performance |
On Tue, Dec 4, 2012 at 3:42 PM, Jeff Janes <jeff(dot)janes(at)gmail(dot)com> wrote:
(Regarding http://explain.depesz.com/s/4MWG, wrote)
>
> But I am curious about how the cost estimate for the primary key look
> up is arrived at:
>
> Index Scan using cons_pe_primary_key on position_effect
> (cost=0.00..42.96 rows=1 width=16)
>
> There should be a random page for the index leaf page, and a random
> page for the heap page. Since you set random_page_cost to 2, that
> comes up to 4. Then there would be some almost negligible CPU costs.
> Where the heck is the extra 38 cost coming from?
I now see where the cost is coming from. In commit 21a39de5809 (first
appearing in 9.2) the "fudge factor" cost estimate for large indexes
was increased by about 10 fold, which really hits this index hard.
This was fixed in commit bf01e34b556 "Tweak genericcostestimate's
fudge factor for index size", by changing it to use the log of the
index size. But that commit probably won't be shipped until 9.3.
I'm not sure that this change would fix your problem, because it might
also change the costs of the alternative plans in a way that
neutralizes things. But I suspect it would fix it. Of course, a
correct estimate of the join size would also fix it--you have kind of
a perfect storm here.
Cheers,
Jeff
| From: | Claudio Freire <klaussfreire(at)gmail(dot)com> |
|---|---|
| To: | Jeff Janes <jeff(dot)janes(at)gmail(dot)com> |
| Cc: | postgresql(at)foo(dot)me(dot)uk, postgres performance list <pgsql-performance(at)postgresql(dot)org> |
| Subject: | Re: Slow query: bitmap scan troubles |
| Date: | 2012-12-05 17:43:49 |
| Message-ID: | CAGTBQpZa4Ru68pu6GiewBZUNk1hw8OObXaks6=Lt+-0qBdhjsg@mail.gmail.com |
| Views: | Raw Message | Whole Thread | Download mbox | Resend email |
| Lists: | pgsql-hackers pgsql-performance |
On Wed, Dec 5, 2012 at 2:39 PM, Jeff Janes <jeff(dot)janes(at)gmail(dot)com> wrote:
> I'm not sure that this change would fix your problem, because it might
> also change the costs of the alternative plans in a way that
> neutralizes things. But I suspect it would fix it. Of course, a
> correct estimate of the join size would also fix it--you have kind of
> a perfect storm here.
As far as I can see on the explain, the misestimation is 3x~4x not 200x.
| From: | Tom Lane <tgl(at)sss(dot)pgh(dot)pa(dot)us> |
|---|---|
| To: | Jeff Janes <jeff(dot)janes(at)gmail(dot)com> |
| Cc: | postgresql(at)foo(dot)me(dot)uk, postgres performance list <pgsql-performance(at)postgresql(dot)org> |
| Subject: | Re: Slow query: bitmap scan troubles |
| Date: | 2012-12-05 18:05:10 |
| Message-ID: | 9022.1354730710@sss.pgh.pa.us |
| Views: | Raw Message | Whole Thread | Download mbox | Resend email |
| Lists: | pgsql-hackers pgsql-performance |
Jeff Janes <jeff(dot)janes(at)gmail(dot)com> writes:
> I now see where the cost is coming from. In commit 21a39de5809 (first
> appearing in 9.2) the "fudge factor" cost estimate for large indexes
> was increased by about 10 fold, which really hits this index hard.
> This was fixed in commit bf01e34b556 "Tweak genericcostestimate's
> fudge factor for index size", by changing it to use the log of the
> index size. But that commit probably won't be shipped until 9.3.
Hm. To tell you the truth, in October I'd completely forgotten about
the January patch, and was thinking that the 1/10000 cost had a lot
of history behind it. But if we never shipped it before 9.2 then of
course that idea is false. Perhaps we should backpatch the log curve
into 9.2 --- that would reduce the amount of differential between what
9.2 does and what previous branches do for large indexes.
It would definitely be interesting to know if applying bf01e34b556
helps the OP's example.
regards, tom lane
| From: | <postgresql(at)foo(dot)me(dot)uk> |
|---|---|
| To: | "'postgres performance list'" <pgsql-performance(at)postgresql(dot)org> |
| Subject: | Re: Slow query: bitmap scan troubles |
| Date: | 2012-12-06 12:52:07 |
| Message-ID: | 0b8901cdd3b0$83a55dd0$8af01970$@foo.me.uk |
| Views: | Raw Message | Whole Thread | Download mbox | Resend email |
| Lists: | pgsql-hackers pgsql-performance |
That is very interesting indeed, these indexes are quite large!
I will apply that patch and try it out this evening and let you know.
Thank you very much everyone for your time, the support has been amazing.
PS: Just looked at this thread on the archives page and realised I don't
have my name in FROM: field, which is a misconfiguration of my email client,
but figured I would leave it to prevent confusion, sorry about that.
All the best,
Philip Scott
-----Original Message-----
From: Tom Lane [mailto:tgl(at)sss(dot)pgh(dot)pa(dot)us]
Sent: 05 December 2012 18:05
To: Jeff Janes
Cc: postgresql(at)foo(dot)me(dot)uk; postgres performance list
Subject: Re: [PERFORM] Slow query: bitmap scan troubles
Jeff Janes <jeff(dot)janes(at)gmail(dot)com> writes:
> I now see where the cost is coming from. In commit 21a39de5809 (first
> appearing in 9.2) the "fudge factor" cost estimate for large indexes
> was increased by about 10 fold, which really hits this index hard.
> This was fixed in commit bf01e34b556 "Tweak genericcostestimate's
> fudge factor for index size", by changing it to use the log of the
> index size. But that commit probably won't be shipped until 9.3.
Hm. To tell you the truth, in October I'd completely forgotten about the
January patch, and was thinking that the 1/10000 cost had a lot of history
behind it. But if we never shipped it before 9.2 then of course that idea
is false. Perhaps we should backpatch the log curve into 9.2 --- that would
reduce the amount of differential between what
9.2 does and what previous branches do for large indexes.
It would definitely be interesting to know if applying bf01e34b556 helps the
OP's example.
regards, tom lane
| From: | <postgresql(at)foo(dot)me(dot)uk> |
|---|---|
| To: | "'postgres performance list'" <pgsql-performance(at)postgresql(dot)org> |
| Subject: | Re: Slow query: bitmap scan troubles |
| Date: | 2012-12-06 12:56:26 |
| Message-ID: | 0b8b01cdd3b1$1a55b8b0$4f012a10$@foo.me.uk |
| Views: | Raw Message | Whole Thread | Download mbox | Resend email |
| Lists: | pgsql-hackers pgsql-performance |
> I also wonder if increasing (say x10) of default_statistics_target or just
doing ALTER TABLE SET STATISTICS for particular tables will help.
> It will make planned to produce more precise estimations. Do not forget
ANALYZE afer changing it.
Thanks Sergey, I will try this too.
I think the bother here is that this statistics are pretty good (we do
analyse regularly and default_statistics_target is already 1000), but once I
start filtering the two tables the correlations alter quite a bit. I don't
think there is that much that can be done about that :)
- Phil
| From: | <postgresql(at)foo(dot)me(dot)uk> |
|---|---|
| To: | <pgsql-performance(at)postgresql(dot)org> |
| Subject: | Re: Slow query: bitmap scan troubles |
| Date: | 2012-12-06 14:10:29 |
| Message-ID: | 0b9001cdd3bb$760226d0$62067470$@foo.me.uk |
| Views: | Raw Message | Whole Thread | Download mbox | Resend email |
| Lists: | pgsql-hackers pgsql-performance |
Hi Jeff
> It kind of does. The expected speed is predicated on the number of rows
being 200 fold higher. If the number of rows actually was that much higher,
the two speeds might be closer together. That is why it would be
interesting to see a more typical case where the actual number of rows is
closer to the 2000 estimate.
Ah, I see of course. Makes a lot of sense when you think about it. This has
been quite an enlightening adventure into the guts of postgres for me :)
> But I am curious about how the cost estimate for the primary key look up
is arrived at:
( Delt with in your next reply, thanks for figuring that out! I will
certainly try the patch)
> I've heard good things about Greg Smith's book, but I don't know if it
covers this particular thing.
A copy is on its way, thank you.
>> We are in the rather pleasant situation here in that we are willing to
>> spend money on the box (up to a point, but quite a large point) to get
>> it up to the spec so that it should hardly ever need to touch the
>> disk, the trick is figuring out how to let our favourite database server
know that.
> Well, that part is fairly easy. Make random_page_cost and seq_page_cost
much smaller than their defaults. Like, 0.04 and 0.03, for example.
Yes, I have been playing a lot with that it makes a lot of difference. When
I tweak them down I end up getting a lot of nested loops instead of hash or
merge joins and they are much faster (presumably we might have gotten a
nested loop out of the planner if it could correctly estimate the low number
of rows returned).
I've got plenty of ammunition now to dig deeper, you guys have been
invaluable.
Cheers,
Phil
| From: | Jeff Janes <jeff(dot)janes(at)gmail(dot)com> |
|---|---|
| To: | Claudio Freire <klaussfreire(at)gmail(dot)com> |
| Cc: | postgresql(at)foo(dot)me(dot)uk, postgres performance list <pgsql-performance(at)postgresql(dot)org> |
| Subject: | Re: Slow query: bitmap scan troubles |
| Date: | 2012-12-06 17:27:48 |
| Message-ID: | CAMkU=1xXdiB+chgqwzWoN+7qqag9DeMTtDA1HWQYvuot6yDyJg@mail.gmail.com |
| Views: | Raw Message | Whole Thread | Download mbox | Resend email |
| Lists: | pgsql-hackers pgsql-performance |
On Wed, Dec 5, 2012 at 9:43 AM, Claudio Freire <klaussfreire(at)gmail(dot)com> wrote:
> On Wed, Dec 5, 2012 at 2:39 PM, Jeff Janes <jeff(dot)janes(at)gmail(dot)com> wrote:
>> I'm not sure that this change would fix your problem, because it might
>> also change the costs of the alternative plans in a way that
>> neutralizes things. But I suspect it would fix it. Of course, a
>> correct estimate of the join size would also fix it--you have kind of
>> a perfect storm here.
>
> As far as I can see on the explain, the misestimation is 3x~4x not 200x.
It is 3x (14085 vs 4588) for selectivity on one of the tables, "Index
Only Scan using idx_trade_id_book on trade".
But for the join of both tables it is estimate 2120 vs actual 11.
Cheers,
Jeff
| From: | Claudio Freire <klaussfreire(at)gmail(dot)com> |
|---|---|
| To: | Jeff Janes <jeff(dot)janes(at)gmail(dot)com> |
| Cc: | postgresql(at)foo(dot)me(dot)uk, postgres performance list <pgsql-performance(at)postgresql(dot)org> |
| Subject: | Re: Slow query: bitmap scan troubles |
| Date: | 2012-12-06 20:05:09 |
| Message-ID: | CAGTBQpYmSNjV5QsnuQdYqYjJnVGrphUVeFm9nxPOfi5oG5-9UQ@mail.gmail.com |
| Views: | Raw Message | Whole Thread | Download mbox | Resend email |
| Lists: | pgsql-hackers pgsql-performance |
On Thu, Dec 6, 2012 at 2:27 PM, Jeff Janes <jeff(dot)janes(at)gmail(dot)com> wrote:
> On Wed, Dec 5, 2012 at 9:43 AM, Claudio Freire <klaussfreire(at)gmail(dot)com> wrote:
>> On Wed, Dec 5, 2012 at 2:39 PM, Jeff Janes <jeff(dot)janes(at)gmail(dot)com> wrote:
>>> I'm not sure that this change would fix your problem, because it might
>>> also change the costs of the alternative plans in a way that
>>> neutralizes things. But I suspect it would fix it. Of course, a
>>> correct estimate of the join size would also fix it--you have kind of
>>> a perfect storm here.
>>
>> As far as I can see on the explain, the misestimation is 3x~4x not 200x.
>
> It is 3x (14085 vs 4588) for selectivity on one of the tables, "Index
> Only Scan using idx_trade_id_book on trade".
>
> But for the join of both tables it is estimate 2120 vs actual 11.
But the final result set isn't further worked on (except for the
aggregate), which means it doesn't affect the cost by much.
| From: | Jeff Janes <jeff(dot)janes(at)gmail(dot)com> |
|---|---|
| To: | Claudio Freire <klaussfreire(at)gmail(dot)com> |
| Cc: | postgresql(at)foo(dot)me(dot)uk, postgres performance list <pgsql-performance(at)postgresql(dot)org> |
| Subject: | Re: Slow query: bitmap scan troubles |
| Date: | 2012-12-06 21:09:54 |
| Message-ID: | CAMkU=1wpMU8JvDBkxZS0zb5=xqh=_xHRcwvY--YT=6uyOOfZ0g@mail.gmail.com |
| Views: | Raw Message | Whole Thread | Download mbox | Resend email |
| Lists: | pgsql-hackers pgsql-performance |
On Thu, Dec 6, 2012 at 12:05 PM, Claudio Freire <klaussfreire(at)gmail(dot)com> wrote:
> On Thu, Dec 6, 2012 at 2:27 PM, Jeff Janes <jeff(dot)janes(at)gmail(dot)com> wrote:
>> On Wed, Dec 5, 2012 at 9:43 AM, Claudio Freire <klaussfreire(at)gmail(dot)com> wrote:
>>> As far as I can see on the explain, the misestimation is 3x~4x not 200x.
>>
>> It is 3x (14085 vs 4588) for selectivity on one of the tables, "Index
>> Only Scan using idx_trade_id_book on trade".
>>
>> But for the join of both tables it is estimate 2120 vs actual 11.
>
> But the final result set isn't further worked on (except for the
> aggregate), which means it doesn't affect the cost by much.
Good point. Both the NL and hash join do about the same amount of
work probing for success whether the success is actually there or not.
So scratch what I said about the correlation being important, in this
case it is not.
The 3x error is enough to push it over the edge, but the fudge factor
is what gets it so close to that edge in the first place.
And I'm now pretty sure the fudge factor change would fix this. The
truly-fast NL plan is getting overcharged by the fudge-factor once per
each 14,085 of the loopings, while the truly-slow bitmap scan is
overcharged only once for the entire scan. So the change is by no
means neutralized between the two plans.
I don't know if my other theory that the bitmap scan is overflowing
work_mem (but not costed for doing so) is also contributing.
Cheers,
Jeff
| From: | Guillaume Lelarge <guillaume(at)lelarge(dot)info> |
|---|---|
| To: | Jeff Janes <jeff(dot)janes(at)gmail(dot)com> |
| Cc: | postgresql(at)foo(dot)me(dot)uk, postgres performance list <pgsql-performance(at)postgresql(dot)org> |
| Subject: | Re: Slow query: bitmap scan troubles |
| Date: | 2012-12-08 15:15:42 |
| Message-ID: | 1354979742.1963.11.camel@localhost.localdomain |
| Views: | Raw Message | Whole Thread | Download mbox | Resend email |
| Lists: | pgsql-hackers pgsql-performance |
On Tue, 2012-12-04 at 15:42 -0800, Jeff Janes wrote:
> On Tue, Dec 4, 2012 at 10:03 AM, <postgresql(at)foo(dot)me(dot)uk> wrote:
> >[...]
> >
> > Is there some nice bit of literature somewhere that explains what sort of
> > costs are associated with the different types of lookup?
>
> I've heard good things about Greg Smith's book, but I don't know if it
> covers this particular thing.
>
> Otherwise, I don't know of a good single place which is a tutorial
> rather than a reference (or the code itself)
>
Greg's book is awesome. It really gives a lot of
informations/tips/whatever on performances. I mostly remember all the
informations about hardware, OS, PostgreSQL configuration, and such. Not
much on the EXPLAIN part.
On the EXPLAIN part, you may have better luck with some slides available
here and there.
Robert Haas gave a talk on the query planner at pgCon 2010. The audio
feed of Robert Haas talk is available with this file:
http://www.pgcon.org/2010/audio/15%20The%20PostgreSQL%20Query%
20Planner.mp3
You can also find the slides on
https://sites.google.com/site/robertmhaas/presentations
You can also read the "Explaining the Postgres Query Optimizer" talk
written by Bruce Momjian. It's available there :
http://momjian.us/main/presentations/internals.html
And finally, you can grab my slides over here:
http://www.dalibo.org/_media/understanding_explain.pdf. You have more
than slides. I tried to put a lot of informations in there.
--
Guillaume
http://blog.guillaume.lelarge.info
http://www.dalibo.com
| From: | <postgresql(at)foo(dot)me(dot)uk> |
|---|---|
| To: | "'postgres performance list'" <pgsql-performance(at)postgresql(dot)org> |
| Subject: | Re: Slow query: bitmap scan troubles |
| Date: | 2012-12-10 09:52:42 |
| Message-ID: | 0dfe01cdd6bc$1986e900$4c94bb00$@foo.me.uk |
| Views: | Raw Message | Whole Thread | Download mbox | Resend email |
| Lists: | pgsql-hackers pgsql-performance |
> Greg's book is awesome. It really gives a lot of informations/tips/whatever on performances. I mostly remember all the informations about hardware, OS, PostgreSQL configuration, and such. Not much on the EXPLAIN part.
Arrived this morning :)
> http://www.pgcon.org/2010/audio/15%20The%20PostgreSQL%20Query%
> https://sites.google.com/site/robertmhaas/presentations
> http://momjian.us/main/presentations/internals.html
> http://www.dalibo.org/_media/understanding_explain.pdf
Well that is my evenings occupied for the next week. Thank you kindly.
- Phil
| From: | Jeff Janes <jeff(dot)janes(at)gmail(dot)com> |
|---|---|
| To: | Tom Lane <tgl(at)sss(dot)pgh(dot)pa(dot)us> |
| Cc: | pgsql-hackers <pgsql-hackers(at)postgresql(dot)org> |
| Subject: | Re: [PERFORM] Slow query: bitmap scan troubles |
| Date: | 2012-12-18 06:00:16 |
| Message-ID: | CAMkU=1ykyMgXccv2dAWKOXdDx5U0Qpc28aW6k659hvE7VZEMXQ@mail.gmail.com |
| Views: | Raw Message | Whole Thread | Download mbox | Resend email |
| Lists: | pgsql-hackers pgsql-performance |
[moved to hackers]
On Wednesday, December 5, 2012, Tom Lane wrote:
> Jeff Janes <jeff(dot)janes(at)gmail(dot)com> writes:
> > I now see where the cost is coming from. In commit 21a39de5809 (first
> > appearing in 9.2) the "fudge factor" cost estimate for large indexes
> > was increased by about 10 fold, which really hits this index hard.
>
> > This was fixed in commit bf01e34b556 "Tweak genericcostestimate's
> > fudge factor for index size", by changing it to use the log of the
> > index size. But that commit probably won't be shipped until 9.3.
>
> Hm. To tell you the truth, in October I'd completely forgotten about
> the January patch, and was thinking that the 1/10000 cost had a lot
> of history behind it. But if we never shipped it before 9.2 then of
> course that idea is false. Perhaps we should backpatch the log curve
> into 9.2 --- that would reduce the amount of differential between what
> 9.2 does and what previous branches do for large indexes.
>
I think we should backpatch it for 9.2.3. I've seen another email which is
probably due to the same issue (nested loop vs hash join). And some
monitoring of a database I am responsible for suggests it might be heading
in that direction as well as the size grows.
But I am wondering if it should be present at all in 9.3. When it was
introduced, the argument seemed to be that smaller indexes might be easier
to keep in cache. And surely that is so. But if a larger index that
covers the same type of queries exists when a smaller one also exists, we
can assume the larger one also exists for a reason. While it may be easier
to keep a smaller index in cache, it is not easier to keep both a larger
and a smaller one in cache as the same time. So it seems to me that this
reasoning is a wash. (Countering this argument is that a partial index is
more esoteric, and so if one exists it is more likely to have been
well-thought out)
The argument for increasing the penalty by a factor of 10 was that the
smaller one could be "swamped by noise such as page-boundary-roundoff
behavior". I don't really know what that means, but it seems to me that if
it is so easily swamped by noise, then it probably isn't so important in
the first place which one it chooses. Whereas, I think that even the log
based penalty has the risk of being too much on large indexes. (For one
thing, it implicitly assumes the fan-out ratio at each level of btree is e,
when it will usually be much larger than e.)
One thing which depends on the index size which, as far as I can tell, is
not currently being counted is the cost of comparing the tuples all the way
down the index. This would be proportional to log2(indextuples) *
cpu_index_tuple_cost, or maybe log2(indextuples) *
(cpu_index_tuple_cost+cpu_operator_cost), or something like that. This
cost would depend on the number index tuples, not baserel tuples, and so
would penalize large indexes. It would be much smaller than the current
log(pages/10000) penalty, but it would be more principle-based rather than
heuristic-based.
The log(pages/10000) change is more suitable for back-patching because it
is more conservative, being asymptotic with the previous behavior at the
low end. But I don't think that the case for that previous behavior was
ever all that strong.
If we really want a heuristic to give a bonus to partial indexes, maybe we
should explicitly give them a bonus, rather than penalizing ordinary
indexes.
maybe something like bonus = 0.05 * (reltuples-indextuples)/reltuples
Cheers,
Jeff
>
| From: | Jeff Janes <jeff(dot)janes(at)gmail(dot)com> |
|---|---|
| To: | Tom Lane <tgl(at)sss(dot)pgh(dot)pa(dot)us> |
| Cc: | pgsql-hackers <pgsql-hackers(at)postgresql(dot)org> |
| Subject: | Re: [PERFORM] Slow query: bitmap scan troubles |
| Date: | 2012-12-19 01:05:05 |
| Message-ID: | CAMkU=1xKAGpT9-t3NkQO1=MRBaMudjZA2OKowSYJxACb7nvorQ@mail.gmail.com |
| Views: | Raw Message | Whole Thread | Download mbox | Resend email |
| Lists: | pgsql-hackers pgsql-performance |
[moved to hackers]
On Wednesday, December 5, 2012, Tom Lane wrote:
> Jeff Janes <jeff(dot)janes(at)gmail(dot)com <javascript:;>> writes:
> > I now see where the cost is coming from. In commit 21a39de5809 (first
> > appearing in 9.2) the "fudge factor" cost estimate for large indexes
> > was increased by about 10 fold, which really hits this index hard.
>
> > This was fixed in commit bf01e34b556 "Tweak genericcostestimate's
> > fudge factor for index size", by changing it to use the log of the
> > index size. But that commit probably won't be shipped until 9.3.
>
> Hm. To tell you the truth, in October I'd completely forgotten about
> the January patch, and was thinking that the 1/10000 cost had a lot
> of history behind it. But if we never shipped it before 9.2 then of
> course that idea is false. Perhaps we should backpatch the log curve
> into 9.2 --- that would reduce the amount of differential between what
> 9.2 does and what previous branches do for large indexes.
>
I think we should backpatch it for 9.2.3. I've seen another email which is
probably due to the same issue (nested loop vs hash join). And some
monitoring of a database I am responsible for suggests it might be heading
in that direction as well as the size grows.
But I am wondering if it should be present at all in 9.3. When it was
introduced, the argument seemed to be that smaller indexes might be easier
to keep in cache. And surely that is so. But if a larger index that
covers the same type of queries exists when a smaller one also exists, we
can assume the larger one also exists for a reason. While it may be easier
to keep a smaller index in cache, it is not easier to keep both a larger
and a smaller one in cache as the same time. So it seems to me that this
reasoning is a wash. (Countering this argument is that a partial index is
more esoteric, and so if one exists it is more likely to have been
well-thought out)
The argument for increasing the penalty by a factor of 10 was that the
smaller one could be "swamped by noise such as page-boundary-roundoff
behavior". I don't really know what that means, but it seems to me that if
it is so easily swamped by noise, then it probably isn't so important in
the first place which one it chooses. Whereas, I think that even the log
based penalty has the risk of being too much on large indexes. (For one
thing, it implicitly assumes the fan-out ratio at each level of btree is e,
when it will usually be much larger than e.)
One thing which depends on the index size which, as far as I can tell, is
not currently being counted is the cost of comparing the tuples all the way
down the index. This would be proportional to log2(indextuples) *
cpu_index_tuple_cost, or maybe log2(indextuples) *
(cpu_index_tuple_cost+cpu_operator_cost), or something like that. This
cost would depend on the number index tuples, not baserel tuples, and so
would penalize large indexes. It would be much smaller than the current
log(pages/10000) penalty, but it would be more principle-based rather than
heuristic-based.
The log(pages/10000) change is more suitable for back-patching because it
is more conservative, being asymptotic with the previous behavior at the
low end. But I don't think that the case for that previous behavior was
ever all that strong.
If we really want a heuristic to give a bonus to partial indexes, maybe we
should explicitly give them a bonus, rather than penalizing ordinary
indexes (which penalty is then used in comparing them to hash joins and
such, not just partial indexes).
maybe something like bonus = 0.05 * (reltuples-indextuples)/reltuples
Cheers,
Jeff
>
| From: | Jeff Janes <jeff(dot)janes(at)gmail(dot)com> |
|---|---|
| To: | Tom Lane <tgl(at)sss(dot)pgh(dot)pa(dot)us> |
| Cc: | pgsql-hackers <pgsql-hackers(at)postgresql(dot)org> |
| Subject: | Re: [PERFORM] Slow query: bitmap scan troubles |
| Date: | 2012-12-19 14:40:54 |
| Message-ID: | CAMkU=1zOHs==DYLeqbOZFfjV=J0BroKmmJc9zgTJN2Aj4c5qYQ@mail.gmail.com |
| Views: | Raw Message | Whole Thread | Download mbox | Resend email |
| Lists: | pgsql-hackers pgsql-performance |
On Tue, Dec 18, 2012 at 5:05 PM, Jeff Janes <jeff(dot)janes(at)gmail(dot)com> wrote:
Sorry for the malformed and duplicate post. I was not trying to be
emphatic; I was testing out gmail offline. Clearly the test didn't go
too well.
Jeff
| From: | Tom Lane <tgl(at)sss(dot)pgh(dot)pa(dot)us> |
|---|---|
| To: | Jeff Janes <jeff(dot)janes(at)gmail(dot)com> |
| Cc: | pgsql-hackers <pgsql-hackers(at)postgresql(dot)org> |
| Subject: | Re: [PERFORM] Slow query: bitmap scan troubles |
| Date: | 2013-01-05 22:18:16 |
| Message-ID: | 28944.1357424296@sss.pgh.pa.us |
| Views: | Raw Message | Whole Thread | Download mbox | Resend email |
| Lists: | pgsql-hackers pgsql-performance |
Jeff Janes <jeff(dot)janes(at)gmail(dot)com> writes:
> [moved to hackers]
> On Wednesday, December 5, 2012, Tom Lane wrote:
>> Hm. To tell you the truth, in October I'd completely forgotten about
>> the January patch, and was thinking that the 1/10000 cost had a lot
>> of history behind it. But if we never shipped it before 9.2 then of
>> course that idea is false. Perhaps we should backpatch the log curve
>> into 9.2 --- that would reduce the amount of differential between what
>> 9.2 does and what previous branches do for large indexes.
> I think we should backpatch it for 9.2.3. I've seen another email which is
> probably due to the same issue (nested loop vs hash join). And some
> monitoring of a database I am responsible for suggests it might be heading
> in that direction as well as the size grows.
I received an off-list report of a case where not only did the 1/10000
factor cause a nestloop-vs-hashjoin decision to be made wrongly, but
even adding the ln() computation as in commit bf01e34b556 didn't fix it.
I believe the index in question was on the order of 20000 pages, so
it's not too hard to see why this might be the case:
* historical fudge factor 4 * 20000/100000 = 0.8
* 9.2 fudge factor 4 * 20000/10000 = 8.0
* with ln() correction 4 * ln(1 + 20000/10000) = 4.39 or so
At this point I'm about ready to not only revert the 100000-to-10000
change, but keep the ln() adjustment, ie make the calculation be
random_page_cost * ln(1 + index_pages/100000). This would give
essentially the pre-9.2 behavior for indexes up to some tens of
thousands of pages, and keep the fudge factor from getting out of
control even for very very large indexes.
> But I am wondering if it should be present at all in 9.3. When it was
> introduced, the argument seemed to be that smaller indexes might be easier
> to keep in cache.
No. The argument is that if we don't have some such correction, the
planner is liable to believe that different-sized indexes have *exactly
the same cost*, if a given query would fetch the same number of index
entries. This is quite easy to demonstrate when experimenting with
partial indexes, in particular - without the fudge factor the planner
sees no advantage of a partial index over a full index from which the
query would fetch the same number of entries. We do want the planner
to pick the partial index if it's usable, and a fudge factor is about
the least unprincipled way to make it do so.
> The argument for increasing the penalty by a factor of 10 was that the
> smaller one could be "swamped by noise such as page-boundary-roundoff
> behavior".
Yeah, I wrote that, but in hindsight it seems like a mistaken idea.
The noise problem is that because we round off page count and row count
estimates to integers at various places, it's fairly easy for small
changes in statistics to move a plan's estimated cost by significantly
more than this fudge factor will. However, the case that the fudge
factor is meant to fix is indexes that are otherwise identical for
the query's purposes --- and any roundoff effects will be the same.
(The fudge factor itself is *not* rounded off anywhere, it flows
directly to the bottom-line cost for the indexscan.)
> One thing which depends on the index size which, as far as I can tell, is
> not currently being counted is the cost of comparing the tuples all the way
> down the index. This would be proportional to log2(indextuples) *
> cpu_index_tuple_cost, or maybe log2(indextuples) *
> (cpu_index_tuple_cost+cpu_operator_cost), or something like that.
Yeah, I know. I've experimented repeatedly over the years with trying
to account explicitly for index descent costs. But every time, anything
that looks even remotely principled turns out to produce an overly large
correction that results in bad plan choices. I don't know exactly why
this is, but it's true.
One other point is that I think it is better for any such correction
to depend on the index's total page count, not total tuple count,
because otherwise two indexes that are identical except for bloat
effects will appear to have identical costs. So from that standpoint,
the ln() form of the fudge factor seems quite reasonable as a crude form
of index descent cost estimate. The fact that we're needing to dial
it down so much reinforces my feeling that descent costs are close to
negligible in practice.
regards, tom lane
| From: | Jeff Janes <jeff(dot)janes(at)gmail(dot)com> |
|---|---|
| To: | Tom Lane <tgl(at)sss(dot)pgh(dot)pa(dot)us> |
| Cc: | pgsql-hackers <pgsql-hackers(at)postgresql(dot)org> |
| Subject: | Re: [PERFORM] Slow query: bitmap scan troubles |
| Date: | 2013-01-06 16:29:17 |
| Message-ID: | CAMkU=1zYe4eujgrvBMsZLS8gjZg2hn+eWr_r8D17J-1FanzKog@mail.gmail.com |
| Views: | Raw Message | Whole Thread | Download mbox | Resend email |
| Lists: | pgsql-hackers pgsql-performance |
On Saturday, January 5, 2013, Tom Lane wrote:
> Jeff Janes <jeff(dot)janes(at)gmail(dot)com <javascript:;>> writes:
> > [moved to hackers]
> > On Wednesday, December 5, 2012, Tom Lane wrote:
> >> Hm. To tell you the truth, in October I'd completely forgotten about
> >> the January patch, and was thinking that the 1/10000 cost had a lot
> >> of history behind it. But if we never shipped it before 9.2 then of
> >> course that idea is false. Perhaps we should backpatch the log curve
> >> into 9.2 --- that would reduce the amount of differential between what
> >> 9.2 does and what previous branches do for large indexes.
>
> > I think we should backpatch it for 9.2.3. I've seen another email which
> is
> > probably due to the same issue (nested loop vs hash join). And some
> > monitoring of a database I am responsible for suggests it might be
> heading
> > in that direction as well as the size grows.
>
> I received an off-list report of a case where not only did the 1/10000
> factor cause a nestloop-vs-hashjoin decision to be made wrongly, but
> even adding the ln() computation as in commit bf01e34b556 didn't fix it.
> I believe the index in question was on the order of 20000 pages, so
> it's not too hard to see why this might be the case:
>
> * historical fudge factor 4 * 20000/100000 = 0.8
> * 9.2 fudge factor 4 * 20000/10000 = 8.0
> * with ln() correction 4 * ln(1 + 20000/10000) = 4.39 or so
>
> At this point I'm about ready to not only revert the 100000-to-10000
> change, but keep the ln() adjustment, ie make the calculation be
> random_page_cost * ln(1 + index_pages/100000). This would give
> essentially the pre-9.2 behavior for indexes up to some tens of
> thousands of pages, and keep the fudge factor from getting out of
> control even for very very large indexes.
>
Yeah, I agree that even the log function grows too rapidly, especially at
the early stages. I didn't know if a change that changes that asymptote
would be welcome in a backpatch, though.
>
> > But I am wondering if it should be present at all in 9.3. When it was
> > introduced, the argument seemed to be that smaller indexes might be
> easier
> > to keep in cache.
>
> No. The argument is that if we don't have some such correction, the
> planner is liable to believe that different-sized indexes have *exactly
> the same cost*, if a given query would fetch the same number of index
> entries.
But it seems like they very likely *do* have exactly the same cost, unless
you want to take either the CPU cost of descending the index into account,
or take cachebility into account. If they do have the same cost, why
shouldn't the estimate reflect that? Using cpu_index_tuple_cost * lg(#
index tuples) would break the tie, but by such a small amount that it would
easily get swamped by the stochastic nature of ANALYZE for nodes expected
to return more than one row.
> This is quite easy to demonstrate when experimenting with
> partial indexes, in particular - without the fudge factor the planner
> sees no advantage of a partial index over a full index from which the
> query would fetch the same number of entries. We do want the planner
> to pick the partial index if it's usable, and a fudge factor is about
> the least unprincipled way to make it do so.
>
I noticed a long time ago that ordinary index scans seemed to be preferred
over bitmap index scans with the same cost estimate, as best as I could
determine because they are tested first and the tie goes to the first one
(and there is something about it needs to be better by 1% to be counted as
better--although that part might only apply when the start-up cost and the
full cost disagree over which one is best). If I've reconstructed that
correctly, could something similar be done for partial indexes, where they
are just considered first? I guess the problem there is a index scan on a
partial index is not a separate node type from a index scan on a full
index, unlike index vs bitmap.
>
> > The argument for increasing the penalty by a factor of 10 was that the
> > smaller one could be "swamped by noise such as page-boundary-roundoff
> > behavior".
>
> Yeah, I wrote that, but in hindsight it seems like a mistaken idea.
> The noise problem is that because we round off page count and row count
> estimates to integers at various places, it's fairly easy for small
> changes in statistics to move a plan's estimated cost by significantly
> more than this fudge factor will. However, the case that the fudge
> factor is meant to fix is indexes that are otherwise identical for
> the query's purposes --- and any roundoff effects will be the same.
> (The fudge factor itself is *not* rounded off anywhere, it flows
> directly to the bottom-line cost for the indexscan.)
>
OK, and this agrees with my experience. It seemed like it was the
stochastic nature of analyze, not round off problems, that caused the plans
to go back and forth.
>
> > One thing which depends on the index size which, as far as I can tell, is
> > not currently being counted is the cost of comparing the tuples all the
> way
> > down the index. This would be proportional to log2(indextuples) *
> > cpu_index_tuple_cost, or maybe log2(indextuples) *
> > (cpu_index_tuple_cost+cpu_operator_cost), or something like that.
>
> Yeah, I know. I've experimented repeatedly over the years with trying
> to account explicitly for index descent costs. But every time, anything
> that looks even remotely principled turns out to produce an overly large
> correction that results in bad plan choices. I don't know exactly why
> this is, but it's true.
>
log2(indextuples) * cpu_index_tuple_cost should produce pretty darn small
corrections, at least if cost parameters are at the defaults. Do you
remember if that one of the ones you tried?
>
> One other point is that I think it is better for any such correction
> to depend on the index's total page count, not total tuple count,
> because otherwise two indexes that are identical except for bloat
> effects will appear to have identical costs.
This isn't so. A bloated index will be estimated to visit more pages than
an otherwise identical non-bloated index, and so have a higher cost.
jeff=# create table bar as select * from generate_series(1,1000000);
jeff=# create index foo1 on bar (generate_series);
jeff=# create index foo2 on bar (generate_series);
jeff=# delete from bar where generate_series %100 !=0;
jeff=# reindex index foo1;
jeff=# analyze ;
jeff=# explain select count(*) from bar where generate_series between 6 and
60;
QUERY PLAN
--------------------------------------------------------------------------
Aggregate (cost=8.27..8.28 rows=1 width=0)
-> Index Scan using foo1 on bar (cost=0.00..8.27 rows=1 width=0)
Index Cond: ((generate_series >= 6) AND (generate_series <= 60))
(3 rows)
jeff=# begin; drop index foo1; explain select count(*) from bar where
generate_series between 6 and 600; rollback;
QUERY PLAN
---------------------------------------------------------------------------
Aggregate (cost=14.47..14.48 rows=1 width=0)
-> Index Scan using foo2 on bar (cost=0.00..14.46 rows=5 width=0)
Index Cond: ((generate_series >= 6) AND (generate_series <= 600))
(3 rows)
This is due to this in genericcostestimate
if (index->pages > 1 && index->tuples > 1)
numIndexPages = ceil(numIndexTuples * index->pages / index->tuples);
If the index is bloated (or just has wider index tuples), index->pages will
go up but index->tuples will not.
If it is just a partial index, however, then both will go down together and
it will not be counted as a benefit from being smaller.
For the bloated index, this correction might even be too harsh. If the
index is bloated by having lots of mostly-empty pages, then this seems
fair. If it is bloated by having lots of entirely empty pages that are not
even linked into the tree, then those empty ones will never be visited and
so it shouldn't be penalized.
Worse, this over-punishment of bloat is more likely to penalize partial
indexes. Since they are vacuumed on the table's schedule, not their own
schedule, they likely get vacuumed less often relative to the amount of
turn-over they experience and so have higher steady-state bloat. (I'm
assuming the partial index is on the particularly hot rows, which I would
expect is how partial indexes would generally be used)
This extra bloat was one of the reasons the partial index was avoided in
"Why does the query planner use two full indexes, when a dedicated partial
index exists?"
So from that standpoint,
> the ln() form of the fudge factor seems quite reasonable as a crude form
> of index descent cost estimate. The fact that we're needing to dial
> it down so much reinforces my feeling that descent costs are close to
> negligible in practice.
>
If they are negligible, why do we really care that it use a partial index
vs a full index? It seems like the only reason we would care is
cacheability. Unfortunately we don't have any infrastructure to model that
directly.
Cheers,
Jeff
| From: | Tom Lane <tgl(at)sss(dot)pgh(dot)pa(dot)us> |
|---|---|
| To: | Jeff Janes <jeff(dot)janes(at)gmail(dot)com> |
| Cc: | pgsql-hackers <pgsql-hackers(at)postgresql(dot)org> |
| Subject: | Re: [PERFORM] Slow query: bitmap scan troubles |
| Date: | 2013-01-06 18:18:03 |
| Message-ID: | 17517.1357496283@sss.pgh.pa.us |
| Views: | Raw Message | Whole Thread | Download mbox | Resend email |
| Lists: | pgsql-hackers pgsql-performance |
Jeff Janes <jeff(dot)janes(at)gmail(dot)com> writes:
> On Saturday, January 5, 2013, Tom Lane wrote:
>> Jeff Janes <jeff(dot)janes(at)gmail(dot)com <javascript:;>> writes:
>>> One thing which depends on the index size which, as far as I can tell, is
>>> not currently being counted is the cost of comparing the tuples all the way
>>> down the index. This would be proportional to log2(indextuples) *
>>> cpu_index_tuple_cost, or maybe log2(indextuples) *
>>> (cpu_index_tuple_cost+cpu_operator_cost), or something like that.
>> Yeah, I know. I've experimented repeatedly over the years with trying
>> to account explicitly for index descent costs. But every time, anything
>> that looks even remotely principled turns out to produce an overly large
>> correction that results in bad plan choices. I don't know exactly why
>> this is, but it's true.
> log2(indextuples) * cpu_index_tuple_cost should produce pretty darn small
> corrections, at least if cost parameters are at the defaults. Do you
> remember if that one of the ones you tried?
Well, a picture is worth a thousand words, so see the attached plot of
the various proposed corrections for indexes of 10 to 1e9 tuples. For
purposes of argument I've supposed that the index has loading factor
256 tuples/page, and I used the default values of random_page_cost and
cpu_index_tuple_cost. The red line is your proposal, the green one is
mine, the blue one is current HEAD behavior.
Both the blue and green lines get to values that might be thought
excessively high for very large indexes, but I doubt that that really
matters: if the table contains a billion rows, the cost of a seqscan
will be so high that it'll hardly matter if we overshoot the cost of an
index probe a bit. (Also, once the table gets that large it's debatable
whether the upper index levels all fit in cache, so charging an extra
random_page_cost or so isn't necessarily unrealistic.)
The real problem though is at the other end of the graph: I judge that
the red line represents an overcorrection for indexes of a few thousand
tuples.
It might also be worth noting that for indexes of a million or so
tuples, we're coming out to about the same place anyway.
>> One other point is that I think it is better for any such correction
>> to depend on the index's total page count, not total tuple count,
>> because otherwise two indexes that are identical except for bloat
>> effects will appear to have identical costs.
> This isn't so. A bloated index will be estimated to visit more pages than
> an otherwise identical non-bloated index, and so have a higher cost.
No it won't, or at least not reliably so, if there is no form of
correction for index descent costs. For instance, in a probe into a
unique index, we'll always estimate that we're visiting a single index
tuple on a single index page. The example you show is tweaked to ensure
that it estimates visiting more than one index page, and in that context
the leaf-page-related costs probably do scale with bloat; but they won't
if the query is only looking for one index entry.
> For the bloated index, this correction might even be too harsh. If the
> index is bloated by having lots of mostly-empty pages, then this seems
> fair. If it is bloated by having lots of entirely empty pages that are not
> even linked into the tree, then those empty ones will never be visited and
> so it shouldn't be penalized.
It's true that an un-linked empty page adds no cost by itself. But if
there are a lot of now-empty pages, that probably means a lot of vacant
space on upper index pages (which must once have held downlinks to those
pages). Which means more upper pages traversed to get to the target
leaf page than we'd have in a non-bloated index. Without more
experimental evidence than we've got at hand, I'm disinclined to suppose
that index bloat is free.
> This extra bloat was one of the reasons the partial index was avoided in
> "Why does the query planner use two full indexes, when a dedicated partial
> index exists?"
Interesting point, but it's far from clear that the planner was wrong in
supposing that that bloat had significant cost. We agree that the
current 9.2 correction is too large, but it doesn't follow that zero is
a better value.
>> So from that standpoint,
>> the ln() form of the fudge factor seems quite reasonable as a crude form
>> of index descent cost estimate. The fact that we're needing to dial
>> it down so much reinforces my feeling that descent costs are close to
>> negligible in practice.
> If they are negligible, why do we really care that it use a partial index
> vs a full index?
TBH, in situations like the ones I'm thinking about it's not clear that
a partial index is a win at all. The cases where a partial index really
wins are where it doesn't index rows that you would otherwise have to
visit and make a non-indexed predicate test against --- and those costs
we definitely do model. However, if the planner doesn't pick the
partial index if available, people are going to report that as a bug.
They won't be able to find out that they're wasting their time defining
a partial index if the planner won't pick it.
So, between the bloat issue and the partial-index issue, I think it's
important that there be some component of indexscan cost that varies
according to index size, even when the same number of leaf pages and
leaf index entries will be visited. It does not have to be a large
component; all experience to date says that it shouldn't be very large.
But there needs to be something.
regards, tom lane
| Attachment | Content-Type | Size |
|---|---|---|
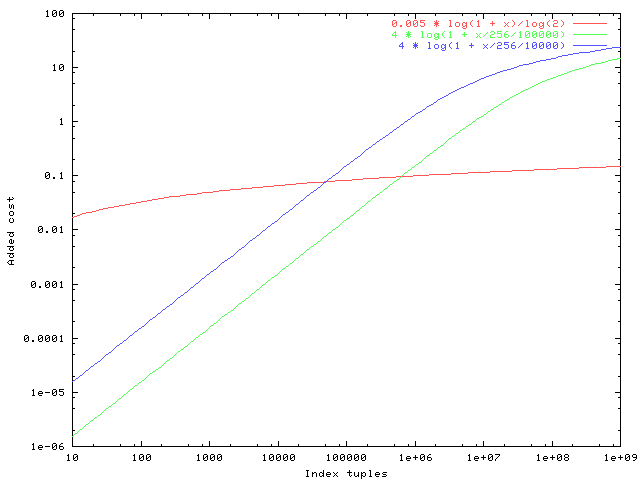
|
image/png | 4.7 KB |
| From: | Simon Riggs <simon(at)2ndQuadrant(dot)com> |
|---|---|
| To: | Tom Lane <tgl(at)sss(dot)pgh(dot)pa(dot)us> |
| Cc: | Jeff Janes <jeff(dot)janes(at)gmail(dot)com>, pgsql-hackers <pgsql-hackers(at)postgresql(dot)org> |
| Subject: | Re: [PERFORM] Slow query: bitmap scan troubles |
| Date: | 2013-01-06 18:19:10 |
| Message-ID: | CA+U5nMLJBrnU+B6md5VR1GHGz6Ji5MEZd6QE+favQYLjv9H8JA@mail.gmail.com |
| Views: | Raw Message | Whole Thread | Download mbox | Resend email |
| Lists: | pgsql-hackers pgsql-performance |
On 5 January 2013 22:18, Tom Lane <tgl(at)sss(dot)pgh(dot)pa(dot)us> wrote:
>> But I am wondering if it should be present at all in 9.3. When it was
>> introduced, the argument seemed to be that smaller indexes might be easier
>> to keep in cache.
>
> No. The argument is that if we don't have some such correction, the
> planner is liable to believe that different-sized indexes have *exactly
> the same cost*, if a given query would fetch the same number of index
> entries.
The only difference between a large and a small index is the initial
fetch, since the depth of the index may vary. After that the size of
the index is irrelevant to the cost of the scan, since we're just
scanning across the leaf blocks. (Other differences may exist but not
related to size).
Perhaps the cost of the initial fetch is what you mean by a
"correction"? In that case, why not use the index depth directly from
the metapage, rather than play with size?
--
Simon Riggs http://www.2ndQuadrant.com/
PostgreSQL Development, 24x7 Support, Training & Services
| From: | Simon Riggs <simon(at)2ndQuadrant(dot)com> |
|---|---|
| To: | Jeff Janes <jeff(dot)janes(at)gmail(dot)com> |
| Cc: | Tom Lane <tgl(at)sss(dot)pgh(dot)pa(dot)us>, pgsql-hackers <pgsql-hackers(at)postgresql(dot)org> |
| Subject: | Re: [PERFORM] Slow query: bitmap scan troubles |
| Date: | 2013-01-06 18:22:33 |
| Message-ID: | CA+U5nML7drGt_5k3X1jH0XLs+qyhsiT7xy0VRs2Nixm_DRdTUg@mail.gmail.com |
| Views: | Raw Message | Whole Thread | Download mbox | Resend email |
| Lists: | pgsql-hackers pgsql-performance |
On 6 January 2013 16:29, Jeff Janes <jeff(dot)janes(at)gmail(dot)com> wrote:
> Worse, this over-punishment of bloat is more likely to penalize partial
> indexes. Since they are vacuumed on the table's schedule, not their own
> schedule, they likely get vacuumed less often relative to the amount of
> turn-over they experience and so have higher steady-state bloat. (I'm
> assuming the partial index is on the particularly hot rows, which I would
> expect is how partial indexes would generally be used)
That's an interesting thought. Thanks for noticing that.
--
Simon Riggs http://www.2ndQuadrant.com/
PostgreSQL Development, 24x7 Support, Training & Services
| From: | Tom Lane <tgl(at)sss(dot)pgh(dot)pa(dot)us> |
|---|---|
| To: | Simon Riggs <simon(at)2ndQuadrant(dot)com> |
| Cc: | Jeff Janes <jeff(dot)janes(at)gmail(dot)com>, pgsql-hackers <pgsql-hackers(at)postgresql(dot)org> |
| Subject: | Re: [PERFORM] Slow query: bitmap scan troubles |
| Date: | 2013-01-06 18:58:40 |
| Message-ID: | 18164.1357498720@sss.pgh.pa.us |
| Views: | Raw Message | Whole Thread | Download mbox | Resend email |
| Lists: | pgsql-hackers pgsql-performance |
Simon Riggs <simon(at)2ndQuadrant(dot)com> writes:
> On 5 January 2013 22:18, Tom Lane <tgl(at)sss(dot)pgh(dot)pa(dot)us> wrote:
>> No. The argument is that if we don't have some such correction, the
>> planner is liable to believe that different-sized indexes have *exactly
>> the same cost*, if a given query would fetch the same number of index
>> entries.
> The only difference between a large and a small index is the initial
> fetch, since the depth of the index may vary. After that the size of
> the index is irrelevant to the cost of the scan, since we're just
> scanning across the leaf blocks. (Other differences may exist but not
> related to size).
Right: except for the "fudge factor" under discussion, all the indexscan
costs that we model come from accessing index leaf pages and leaf
tuples. So to the extent that the fudge factor has any principled basis
at all, it's an estimate of index descent costs. And in that role I
believe that total index size needs to be taken into account.
> Perhaps the cost of the initial fetch is what you mean by a
> "correction"? In that case, why not use the index depth directly from
> the metapage, rather than play with size?
IIRC, one of my very first attempts to deal with this was to charge
random_page_cost per level of index descended. This was such a horrid
overestimate that it never went anywhere. I think that reflects that in
practical applications, the upper levels of the index tend to stay in
cache. We could ignore I/O on that assumption and still try to model
CPU costs of the descent, which is basically what Jeff is proposing.
My objection to his formula is mainly that it ignores physical index
size, which I think is important to include somehow for the reasons
I explained in my other message.
regards, tom lane
| From: | Simon Riggs <simon(at)2ndQuadrant(dot)com> |
|---|---|
| To: | Tom Lane <tgl(at)sss(dot)pgh(dot)pa(dot)us> |
| Cc: | Jeff Janes <jeff(dot)janes(at)gmail(dot)com>, pgsql-hackers <pgsql-hackers(at)postgresql(dot)org> |
| Subject: | Re: [PERFORM] Slow query: bitmap scan troubles |
| Date: | 2013-01-06 19:47:48 |
| Message-ID: | CA+U5nMLjf2-kTa4-AR-0XLKKwbc+=_fb4237i_UAWYzowW+-1Q@mail.gmail.com |
| Views: | Raw Message | Whole Thread | Download mbox | Resend email |
| Lists: | pgsql-hackers pgsql-performance |
On 6 January 2013 18:58, Tom Lane <tgl(at)sss(dot)pgh(dot)pa(dot)us> wrote:
> Simon Riggs <simon(at)2ndQuadrant(dot)com> writes:
>> On 5 January 2013 22:18, Tom Lane <tgl(at)sss(dot)pgh(dot)pa(dot)us> wrote:
>>> No. The argument is that if we don't have some such correction, the
>>> planner is liable to believe that different-sized indexes have *exactly
>>> the same cost*, if a given query would fetch the same number of index
>>> entries.
>
>> The only difference between a large and a small index is the initial
>> fetch, since the depth of the index may vary. After that the size of
>> the index is irrelevant to the cost of the scan, since we're just
>> scanning across the leaf blocks. (Other differences may exist but not
>> related to size).
>
> Right: except for the "fudge factor" under discussion, all the indexscan
> costs that we model come from accessing index leaf pages and leaf
> tuples. So to the extent that the fudge factor has any principled basis
> at all, it's an estimate of index descent costs. And in that role I
> believe that total index size needs to be taken into account.
>
>> Perhaps the cost of the initial fetch is what you mean by a
>> "correction"? In that case, why not use the index depth directly from
>> the metapage, rather than play with size?
>
> IIRC, one of my very first attempts to deal with this was to charge
> random_page_cost per level of index descended. This was such a horrid
> overestimate that it never went anywhere. I think that reflects that in
> practical applications, the upper levels of the index tend to stay in
> cache. We could ignore I/O on that assumption and still try to model
> CPU costs of the descent, which is basically what Jeff is proposing.
> My objection to his formula is mainly that it ignores physical index
> size, which I think is important to include somehow for the reasons
> I explained in my other message.
Having a well principled approach will help bring us towards a
realistic estimate.
I can well believe what you say about random_page_cost * index_depth
being an over-estimate.
Making a fudge factor be random_page_cost * ln(1 + index_pages/100000)
just seems to presume an effective cache of 8GB and a fixed
depth:size ratio, which it might not be. On a busy system, or with a
very wide index that could also be wrong.
I'd be more inclined to explicitly discount the first few levels by
using random_page_cost * (max(index_depth - 3, 0))
or even better use a formula that includes the effective cache size
and index width to work out the likely number of tree levels cached
for an index.
Whatever we do we must document that we are estimating the cache
effects on the cost of index descent, so we can pick that up on a
future study on cacheing effects.
--
Simon Riggs http://www.2ndQuadrant.com/
PostgreSQL Development, 24x7 Support, Training & Services
| From: | Tom Lane <tgl(at)sss(dot)pgh(dot)pa(dot)us> |
|---|---|
| To: | Simon Riggs <simon(at)2ndQuadrant(dot)com> |
| Cc: | Jeff Janes <jeff(dot)janes(at)gmail(dot)com>, pgsql-hackers <pgsql-hackers(at)postgresql(dot)org> |
| Subject: | Re: [PERFORM] Slow query: bitmap scan troubles |
| Date: | 2013-01-06 23:03:05 |
| Message-ID: | 8539.1357513385@sss.pgh.pa.us |
| Views: | Raw Message | Whole Thread | Download mbox | Resend email |
| Lists: | pgsql-hackers pgsql-performance |
Simon Riggs <simon(at)2ndQuadrant(dot)com> writes:
> On 6 January 2013 18:58, Tom Lane <tgl(at)sss(dot)pgh(dot)pa(dot)us> wrote:
>> IIRC, one of my very first attempts to deal with this was to charge
>> random_page_cost per level of index descended. This was such a horrid
>> overestimate that it never went anywhere. I think that reflects that in
>> practical applications, the upper levels of the index tend to stay in
>> cache. We could ignore I/O on that assumption and still try to model
>> CPU costs of the descent, which is basically what Jeff is proposing.
>> My objection to his formula is mainly that it ignores physical index
>> size, which I think is important to include somehow for the reasons
>> I explained in my other message.
> Having a well principled approach will help bring us towards a
> realistic estimate.
I thought about this some more and came up with what might be a
reasonably principled compromise. Assume that we know there are N
leaf entries in the index (from VACUUM stats) and that we know the
root page height is H (from looking at the btree metapage). (Note:
H starts at zero for a single-page index.) If we assume that the
number of tuples per page, P, is more or less uniform across leaf
and upper pages (ie P is the fanout for upper pages), then we have
N/P = number of leaf pages
N/P/P = number of level 1 pages
N/P^3 = number of level 2 pages
N/P^(h+1) = number of level h pages
Solving for the minimum P that makes N/P^(H+1) <= 1, we get
P = ceil(exp(ln(N)/(H+1)))
as an estimate of P given the known N and H values.
Now, if we consider only CPU costs of index descent, we expect
about log2(P) comparisons to be needed on each of the H upper pages
to be descended through, that is we have total descent cost
cpu_index_tuple_cost * H * log2(P)
If we ignore the ceil() step as being a second-order correction, this
can be simplified to
cpu_index_tuple_cost * H * log2(N)/(H+1)
I propose this, rather than Jeff's formula of cpu_index_tuple_cost *
log2(N), as our fudge factor. The reason I like this better is that
the additional factor of H/(H+1) provides the correction I want for
bloated indexes: if an index is bloated, the way that reflects into
the cost of any particular search is that the number of pages to be
descended through is larger than otherwise. The correction is fairly
small, particularly for large indexes, but that seems to be what's
expected given the rest of our discussion.
We could further extend this by adding some I/O charge when the index is
sufficiently large, as per Simon's comments, but frankly I think that's
unnecessary. Unless the fan-out factor is really awful, practical-sized
indexes probably have all their upper pages in memory. What's more, per
my earlier comment, when you start to think about tables so huge that
that's not true it really doesn't matter if we charge another
random_page_cost or two for an indexscan --- it'll still be peanuts
compared to the seqscan alternative.
To illustrate the behavior of this function, I've replotted my previous
graph, still taking the assumed fanout to be 256 tuples/page. I limited
the range of the functions to 0.0001 to 100 to keep the log-scale graph
readable, but actually the H/(H+1) formulation would charge zero for
indexes of less than 256 tuples. I think it's significant (and a good
thing) that this curve is nowhere significantly more than the historical
pre-9.2 fudge factor.
Thoughts?
regards, tom lane
| Attachment | Content-Type | Size |
|---|---|---|
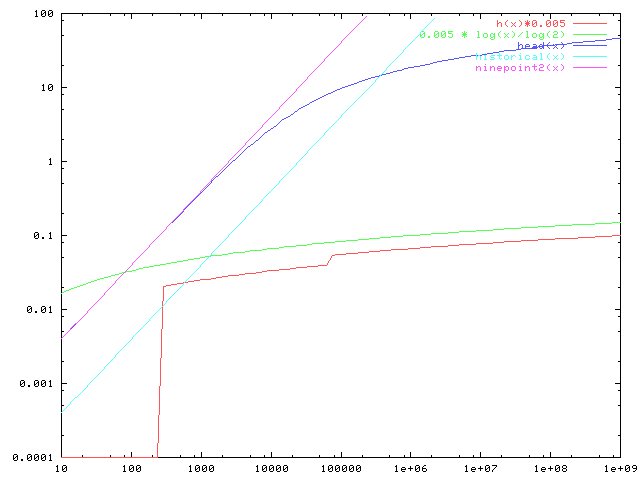
|
image/png | 5.1 KB |
| unknown_filename | text/plain | 526 bytes |
| From: | Tom Lane <tgl(at)sss(dot)pgh(dot)pa(dot)us> |
|---|---|
| To: | Simon Riggs <simon(at)2ndQuadrant(dot)com> |
| Cc: | Jeff Janes <jeff(dot)janes(at)gmail(dot)com>, pgsql-hackers <pgsql-hackers(at)postgresql(dot)org> |
| Subject: | Re: [PERFORM] Slow query: bitmap scan troubles |
| Date: | 2013-01-06 23:17:23 |
| Message-ID: | 8803.1357514243@sss.pgh.pa.us |
| Views: | Raw Message | Whole Thread | Download mbox | Resend email |
| Lists: | pgsql-hackers pgsql-performance |
I wrote:
> [ slightly bogus graph ]
Ooops, it seems the ^ operator doesn't do what I thought in gnuplot.
Here's a corrected version.
regards, tom lane
| Attachment | Content-Type | Size |
|---|---|---|
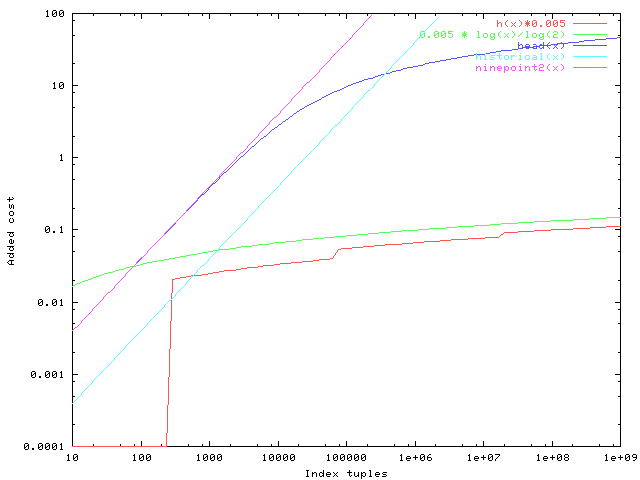
|
image/png | 5.2 KB |
| unknown_filename | text/plain | 610 bytes |
| From: | Simon Riggs <simon(at)2ndQuadrant(dot)com> |
|---|---|
| To: | Tom Lane <tgl(at)sss(dot)pgh(dot)pa(dot)us> |
| Cc: | Jeff Janes <jeff(dot)janes(at)gmail(dot)com>, pgsql-hackers <pgsql-hackers(at)postgresql(dot)org> |
| Subject: | Re: [PERFORM] Slow query: bitmap scan troubles |
| Date: | 2013-01-07 00:03:04 |
| Message-ID: | CA+U5nMKvRhKviNYagHj+X-A__5uFFJEEGzBJe=f40ho2DbVk-Q@mail.gmail.com |
| Views: | Raw Message | Whole Thread | Download mbox | Resend email |
| Lists: | pgsql-hackers pgsql-performance |
On 6 January 2013 23:03, Tom Lane <tgl(at)sss(dot)pgh(dot)pa(dot)us> wrote:
> Simon Riggs <simon(at)2ndQuadrant(dot)com> writes:
>> On 6 January 2013 18:58, Tom Lane <tgl(at)sss(dot)pgh(dot)pa(dot)us> wrote:
>>> IIRC, one of my very first attempts to deal with this was to charge
>>> random_page_cost per level of index descended. This was such a horrid
>>> overestimate that it never went anywhere. I think that reflects that in
>>> practical applications, the upper levels of the index tend to stay in
>>> cache. We could ignore I/O on that assumption and still try to model
>>> CPU costs of the descent, which is basically what Jeff is proposing.
>>> My objection to his formula is mainly that it ignores physical index
>>> size, which I think is important to include somehow for the reasons
>>> I explained in my other message.
>
>> Having a well principled approach will help bring us towards a
>> realistic estimate.
>
> I thought about this some more and came up with what might be a
> reasonably principled compromise. Assume that we know there are N
> leaf entries in the index (from VACUUM stats) and that we know the
> root page height is H (from looking at the btree metapage). (Note:
> H starts at zero for a single-page index.) If we assume that the
> number of tuples per page, P, is more or less uniform across leaf
> and upper pages (ie P is the fanout for upper pages), then we have
> N/P = number of leaf pages
> N/P/P = number of level 1 pages
> N/P^3 = number of level 2 pages
> N/P^(h+1) = number of level h pages
> Solving for the minimum P that makes N/P^(H+1) <= 1, we get
> P = ceil(exp(ln(N)/(H+1)))
> as an estimate of P given the known N and H values.
>
> Now, if we consider only CPU costs of index descent, we expect
> about log2(P) comparisons to be needed on each of the H upper pages
> to be descended through, that is we have total descent cost
> cpu_index_tuple_cost * H * log2(P)
>
> If we ignore the ceil() step as being a second-order correction, this
> can be simplified to
>
> cpu_index_tuple_cost * H * log2(N)/(H+1)
>
> I propose this, rather than Jeff's formula of cpu_index_tuple_cost *
> log2(N), as our fudge factor. The reason I like this better is that
> the additional factor of H/(H+1) provides the correction I want for
> bloated indexes: if an index is bloated, the way that reflects into
> the cost of any particular search is that the number of pages to be
> descended through is larger than otherwise. The correction is fairly
> small, particularly for large indexes, but that seems to be what's
> expected given the rest of our discussion.
Seems good to have something with both N and H in it. This cost model
favours smaller indexes over larger ones, whether that be because
they're partial and so have smaller N, or whether the key values are
thinner and so have lower H.
> We could further extend this by adding some I/O charge when the index is
> sufficiently large, as per Simon's comments, but frankly I think that's
> unnecessary. Unless the fan-out factor is really awful, practical-sized
> indexes probably have all their upper pages in memory. What's more, per
> my earlier comment, when you start to think about tables so huge that
> that's not true it really doesn't matter if we charge another
> random_page_cost or two for an indexscan --- it'll still be peanuts
> compared to the seqscan alternative.
Considering that we're trying to decide between various indexes on one
table, we don't have enough information to say which index the cache
favours and the other aspects of cacheing are the same for all indexes
of any given size. So we can assume those effects cancel out for
comparison purposes, even if they're non-zero. And as you say, they're
negligible in comparison with bitmapindexscans etc..
The only time I'd question that would be in the case of a nested loops
join but that's not important here.
--
Simon Riggs http://www.2ndQuadrant.com/
PostgreSQL Development, 24x7 Support, Training & Services
| From: | Tom Lane <tgl(at)sss(dot)pgh(dot)pa(dot)us> |
|---|---|
| To: | Simon Riggs <simon(at)2ndQuadrant(dot)com> |
| Cc: | Jeff Janes <jeff(dot)janes(at)gmail(dot)com>, pgsql-hackers <pgsql-hackers(at)postgresql(dot)org> |
| Subject: | Re: [PERFORM] Slow query: bitmap scan troubles |
| Date: | 2013-01-07 17:35:51 |
| Message-ID: | 12791.1357580151@sss.pgh.pa.us |
| Views: | Raw Message | Whole Thread | Download mbox | Resend email |
| Lists: | pgsql-hackers pgsql-performance |
I wrote:
> Now, if we consider only CPU costs of index descent, we expect
> about log2(P) comparisons to be needed on each of the H upper pages
> to be descended through, that is we have total descent cost
> cpu_index_tuple_cost * H * log2(P)
> If we ignore the ceil() step as being a second-order correction, this
> can be simplified to
> cpu_index_tuple_cost * H * log2(N)/(H+1)
I thought some more about this and concluded that the above reasoning is
incorrect, because it ignores the fact that initial positioning on the
index leaf page requires another log2(P) comparisons (to locate the
first matching tuple if any). If you include those comparisons then the
H/(H+1) factor drops out and you are left with just "cost * log2(N)",
independently of the tree height.
But all is not lost for including some representation of the physical
index size into this calculation, because it seems plausible to consider
that there is some per-page cost for descending through the upper pages.
It's not nearly as much as random_page_cost, if the pages are cached,
but we don't have to suppose it's zero. So that reasoning leads to a
formula like
cost-per-tuple * log2(N) + cost-per-page * (H+1)
which is better than the above proposal anyway because we can now
twiddle the two cost factors separately rather than being tied to a
fixed idea of how much a larger H hurts.
As for the specific costs to use, I'm now thinking that the
cost-per-tuple should be just cpu_operator_cost (0.0025) not
cpu_index_tuple_cost (0.005). The latter is meant to model costs such
as reporting a TID back out of the index AM to the executor, which is
not what we're doing at an upper index entry. I also propose setting
the per-page cost to some multiple of cpu_operator_cost, since it's
meant to represent a CPU cost not an I/O cost.
There is already a charge of 100 times cpu_operator_cost in
genericcostestimate to model "general costs of starting an indexscan".
I suggest that we should consider half of that to be actual fixed
overhead and half of it to be per-page cost for the first page, then
add another 50 times cpu_operator_cost for each page descended through.
That gives a formula of
cpu_operator_cost * log2(N) + cpu_operator_cost * 50 * (H+2)
This would lead to the behavior depicted in the attached plot, wherein
I've modified the comparison lines (historical, 9.2, and HEAD behaviors)
to include the existing 100 * cpu_operator_cost startup cost charge in
addition to the fudge factor we've been discussing so far. The new
proposed curve is a bit above the historical curve for indexes with
250-5000 tuples, but the value is still quite small there, so I'm not
too worried about that. The people who've been complaining about 9.2's
behavior have indexes much larger than that.
Thoughts?
regards, tom lane
| Attachment | Content-Type | Size |
|---|---|---|
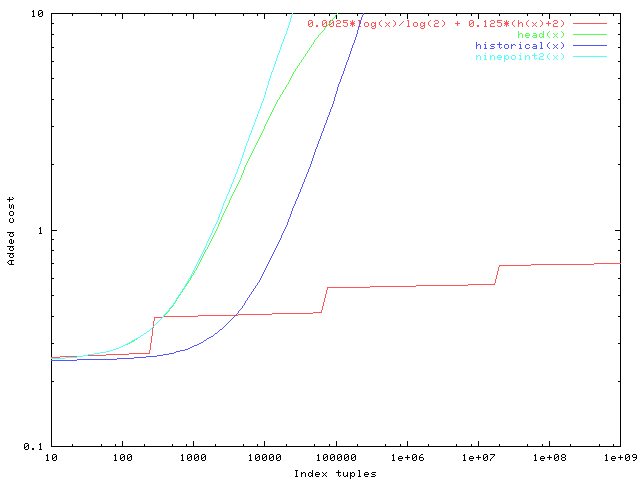
|
image/png | 4.1 KB |
| unknown_filename | text/plain | 486 bytes |
| From: | Simon Riggs <simon(at)2ndQuadrant(dot)com> |
|---|---|
| To: | Tom Lane <tgl(at)sss(dot)pgh(dot)pa(dot)us> |
| Cc: | Jeff Janes <jeff(dot)janes(at)gmail(dot)com>, pgsql-hackers <pgsql-hackers(at)postgresql(dot)org> |
| Subject: | Re: [PERFORM] Slow query: bitmap scan troubles |
| Date: | 2013-01-07 18:03:37 |
| Message-ID: | CA+U5nMKbOGVfQXfJi5_vOUPEatF_V_+e_HX4P5R=tb9JSo2ceA@mail.gmail.com |
| Views: | Raw Message | Whole Thread | Download mbox | Resend email |
| Lists: | pgsql-hackers pgsql-performance |
On 7 January 2013 17:35, Tom Lane <tgl(at)sss(dot)pgh(dot)pa(dot)us> wrote:
> That gives a formula of
>
> cpu_operator_cost * log2(N) + cpu_operator_cost * 50 * (H+2)
>
> This would lead to the behavior depicted in the attached plot, wherein
> I've modified the comparison lines (historical, 9.2, and HEAD behaviors)
> to include the existing 100 * cpu_operator_cost startup cost charge in
> addition to the fudge factor we've been discussing so far. The new
> proposed curve is a bit above the historical curve for indexes with
> 250-5000 tuples, but the value is still quite small there, so I'm not
> too worried about that. The people who've been complaining about 9.2's
> behavior have indexes much larger than that.
>
> Thoughts?
Again, this depends on N and H, so thats good.
I think my retinas detached while reading your explanation, but I'm a
long way from coming up with a better or more principled one.
If we can describe this as a heuristic that appears to fit the
observed costs, we may keep the door open for something better a
little later.
--
Simon Riggs http://www.2ndQuadrant.com/
PostgreSQL Development, 24x7 Support, Training & Services
| From: | Tom Lane <tgl(at)sss(dot)pgh(dot)pa(dot)us> |
|---|---|
| To: | Simon Riggs <simon(at)2ndQuadrant(dot)com> |
| Cc: | Jeff Janes <jeff(dot)janes(at)gmail(dot)com>, pgsql-hackers <pgsql-hackers(at)postgresql(dot)org> |
| Subject: | Re: [PERFORM] Slow query: bitmap scan troubles |
| Date: | 2013-01-07 18:27:38 |
| Message-ID: | 13842.1357583258@sss.pgh.pa.us |
| Views: | Raw Message | Whole Thread | Download mbox | Resend email |
| Lists: | pgsql-hackers pgsql-performance |
Simon Riggs <simon(at)2ndQuadrant(dot)com> writes:
> On 7 January 2013 17:35, Tom Lane <tgl(at)sss(dot)pgh(dot)pa(dot)us> wrote:
>> That gives a formula of
>> cpu_operator_cost * log2(N) + cpu_operator_cost * 50 * (H+2)
> Again, this depends on N and H, so thats good.
> I think my retinas detached while reading your explanation, but I'm a
> long way from coming up with a better or more principled one.
> If we can describe this as a heuristic that appears to fit the
> observed costs, we may keep the door open for something better a
> little later.
I'm fairly happy with the general shape of this formula: it has a
principled explanation and the resulting numbers appear to be sane.
The specific cost multipliers obviously are open to improvement based
on future evidence. (In particular, I intend to code it in a way that
doesn't tie the "startup overhead" and "cost per page" numbers to be
equal, even though I'm setting them equal for the moment for lack of a
better idea.)
One issue that needs some thought is that the argument for this formula
is based entirely on thinking about b-trees. I think it's probably
reasonable to apply it to gist, gin, and sp-gist as well, assuming we
can get some estimate of tree height for those, but it's obviously
hogwash for hash indexes. We could possibly just take H=0 for hash,
and still apply the log2(N) part ... not so much because that is right
as because it's likely too small to matter.
regards, tom lane
| From: | Claudio Freire <klaussfreire(at)gmail(dot)com> |
|---|---|
| To: | Tom Lane <tgl(at)sss(dot)pgh(dot)pa(dot)us> |
| Cc: | Simon Riggs <simon(at)2ndquadrant(dot)com>, Jeff Janes <jeff(dot)janes(at)gmail(dot)com>, pgsql-hackers <pgsql-hackers(at)postgresql(dot)org> |
| Subject: | Re: [PERFORM] Slow query: bitmap scan troubles |
| Date: | 2013-01-07 18:48:12 |
| Message-ID: | CAGTBQpbNJLx+QjksoA4wmChBDkzkBgfxXLDkgaKKrku+JfvqXg@mail.gmail.com |
| Views: | Raw Message | Whole Thread | Download mbox | Resend email |
| Lists: | pgsql-hackers pgsql-performance |
On Mon, Jan 7, 2013 at 3:27 PM, Tom Lane <tgl(at)sss(dot)pgh(dot)pa(dot)us> wrote:
>
> One issue that needs some thought is that the argument for this formula
> is based entirely on thinking about b-trees. I think it's probably
> reasonable to apply it to gist, gin, and sp-gist as well, assuming we
> can get some estimate of tree height for those, but it's obviously
> hogwash for hash indexes. We could possibly just take H=0 for hash,
> and still apply the log2(N) part ... not so much because that is right
> as because it's likely too small to matter.
Height would be more precisely "lookup cost" (in comparisons). Most
indexing structures have a well-studied lookup cost. For b-trees, it's
log_b(size), for hash it's 1 + size/buckets.
| From: | Tom Lane <tgl(at)sss(dot)pgh(dot)pa(dot)us> |
|---|---|
| To: | Simon Riggs <simon(at)2ndQuadrant(dot)com> |
| Cc: | Jeff Janes <jeff(dot)janes(at)gmail(dot)com>, pgsql-hackers <pgsql-hackers(at)postgresql(dot)org> |
| Subject: | Re: [PERFORM] Slow query: bitmap scan troubles |
| Date: | 2013-01-11 01:07:34 |
| Message-ID: | 13967.1357866454@sss.pgh.pa.us |
| Views: | Raw Message | Whole Thread | Download mbox | Resend email |
| Lists: | pgsql-hackers pgsql-performance |
I wrote:
> I'm fairly happy with the general shape of this formula: it has a
> principled explanation and the resulting numbers appear to be sane.
> The specific cost multipliers obviously are open to improvement based
> on future evidence. (In particular, I intend to code it in a way that
> doesn't tie the "startup overhead" and "cost per page" numbers to be
> equal, even though I'm setting them equal for the moment for lack of a
> better idea.)
I realized that there was a rather serious error in the graphs I showed
before: they were computing the old cost models as #tuples/10000 or
#tuples/100000, but really it's #pages. So naturally that moves those
curves down quite a lot. After some playing around I concluded that the
best way to avoid any major increases in the attributed cost is to drop
the constant "costs of indexscan setup" charge that I proposed before.
(That was a little weird anyway since we don't model any similar cost
for any other sort of executor setup.) The attached graph shows the
corrected old cost curves and the proposed new one.
> One issue that needs some thought is that the argument for this formula
> is based entirely on thinking about b-trees. I think it's probably
> reasonable to apply it to gist, gin, and sp-gist as well, assuming we
> can get some estimate of tree height for those, but it's obviously
> hogwash for hash indexes. We could possibly just take H=0 for hash,
> and still apply the log2(N) part ... not so much because that is right
> as because it's likely too small to matter.
In the attached patch, I use the proposed formula for btree, gist, and
spgist indexes. For btree we read out the actual tree height from the
metapage and use that. For gist and spgist there's not a uniquely
determinable tree height, but I propose taking log100(#pages) as a
first-order estimate. For hash, I think we actually don't need any
corrections, for the reasons set out in the comment added to
hashcostestimate. I left the estimate for GIN alone; I've not studied
it enough to know whether it ought to be fooled with, but in any case it
behaves very little like btree.
A big chunk of the patch diff comes from redesigning the API of
genericcostestimate so that it can cheaply pass back some additional
values, so we don't have to recompute those values at the callers.
Other than that and the new code to let btree report out its tree
height, this isn't a large patch. It basically gets rid of the two
ad-hoc calculations in genericcostestimate() and inserts substitute
calculations in the per-index-type functions.
I've verified that this patch results in no changes in the regression
tests. It's worth noting though that there is now a small nonzero
startup-cost charge for indexscans, for example:
regression=# explain select * from tenk1 where unique1 = 42;
QUERY PLAN
-----------------------------------------------------------------------------
Index Scan using tenk1_unique1 on tenk1 (cost=0.29..8.30 rows=1 width=244)
Index Cond: (unique1 = 42)
(2 rows)
where in 9.2 the cost estimate was 0.00..8.28. I personally think this
is a good idea, but we'll have to keep our eyes open to see if it
changes any plans in ways we don't like.
This is of course much too large a change to consider back-patching.
What I now recommend we do about 9.2 is just revert it to the historical
fudge factor (#pages/100000).
Comments?
regards, tom lane
| Attachment | Content-Type | Size |
|---|---|---|
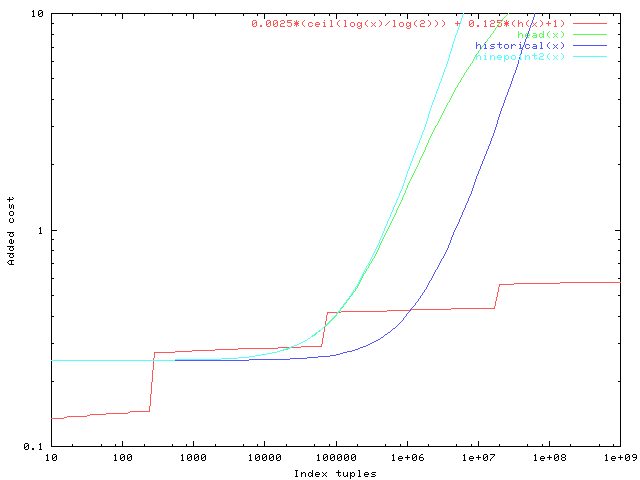
|
image/png | 4.2 KB |
| unknown_filename | text/plain | 497 bytes |
| index-access-costs-1.patch.gz | application/octet-stream | 8.5 KB |
| From: | Robert Haas <robertmhaas(at)gmail(dot)com> |
|---|---|
| To: | Tom Lane <tgl(at)sss(dot)pgh(dot)pa(dot)us> |
| Cc: | Simon Riggs <simon(at)2ndquadrant(dot)com>, Jeff Janes <jeff(dot)janes(at)gmail(dot)com>, pgsql-hackers <pgsql-hackers(at)postgresql(dot)org> |
| Subject: | Re: [PERFORM] Slow query: bitmap scan troubles |
| Date: | 2013-01-14 16:45:01 |
| Message-ID: | CA+TgmoYQ6Nq-tpHiDPCUH3CkH2N9D67=oDKJtLxuRRC=dRteSQ@mail.gmail.com |
| Views: | Raw Message | Whole Thread | Download mbox | Resend email |
| Lists: | pgsql-hackers pgsql-performance |
On Thu, Jan 10, 2013 at 8:07 PM, Tom Lane <tgl(at)sss(dot)pgh(dot)pa(dot)us> wrote:
> Comments?
I'm not sure I have anything intelligent to add to this conversation -
does that make me the wisest of all the Greeks? - but I do think it
worth mentioning that I have heard occasional reports within EDB of
the query planner refusing to use extremely large indexes no matter
how large a hammer was applied. I have never been able to obtain
enough details to understand the parameters of the problem, let alone
reproduce it, but I thought it might be worth mentioning anyway in
case it's both real and related to the case at hand. Basically I
guess that boils down to: it would be good to consider whether the
costing model is correct for an index of, say, 1TB.
--
Robert Haas
EnterpriseDB: http://www.enterprisedb.com
The Enterprise PostgreSQL Company
| From: | Tom Lane <tgl(at)sss(dot)pgh(dot)pa(dot)us> |
|---|---|
| To: | Robert Haas <robertmhaas(at)gmail(dot)com> |
| Cc: | Simon Riggs <simon(at)2ndquadrant(dot)com>, Jeff Janes <jeff(dot)janes(at)gmail(dot)com>, pgsql-hackers <pgsql-hackers(at)postgresql(dot)org> |
| Subject: | Re: [PERFORM] Slow query: bitmap scan troubles |
| Date: | 2013-01-14 17:23:17 |
| Message-ID: | 23869.1358184197@sss.pgh.pa.us |
| Views: | Raw Message | Whole Thread | Download mbox | Resend email |
| Lists: | pgsql-hackers pgsql-performance |
Robert Haas <robertmhaas(at)gmail(dot)com> writes:
> I'm not sure I have anything intelligent to add to this conversation -
> does that make me the wisest of all the Greeks? - but I do think it
> worth mentioning that I have heard occasional reports within EDB of
> the query planner refusing to use extremely large indexes no matter
> how large a hammer was applied. I have never been able to obtain
> enough details to understand the parameters of the problem, let alone
> reproduce it, but I thought it might be worth mentioning anyway in
> case it's both real and related to the case at hand. Basically I
> guess that boils down to: it would be good to consider whether the
> costing model is correct for an index of, say, 1TB.
Well, see the cost curves at
http://www.postgresql.org/message-id/13967.1357866454@sss.pgh.pa.us
The old code definitely had an unreasonably large charge for indexes
exceeding 1e8 or so tuples. This wouldn't matter that much for simple
single-table lookup queries, but I could easily see it putting the
kibosh on uses of an index on the inside of a nestloop.
It's possible that the new code goes too far in the other direction:
we're now effectively assuming that all inner btree pages stay in cache
no matter how large the index is. At some point it'd likely be
appropriate to start throwing in some random_page_cost charges for inner
pages beyond the third/fourth/fifth(?) level, as Simon speculated about
upthread. But I thought we could let that go until we start seeing
complaints traceable to it.
regards, tom lane
| From: | Robert Haas <robertmhaas(at)gmail(dot)com> |
|---|---|
| To: | Tom Lane <tgl(at)sss(dot)pgh(dot)pa(dot)us> |
| Cc: | Simon Riggs <simon(at)2ndquadrant(dot)com>, Jeff Janes <jeff(dot)janes(at)gmail(dot)com>, pgsql-hackers <pgsql-hackers(at)postgresql(dot)org> |
| Subject: | Re: [PERFORM] Slow query: bitmap scan troubles |
| Date: | 2013-01-14 17:50:24 |
| Message-ID: | CA+Tgmoa+wzu9RBUK75veRn6UTWjSZZJa2aOjfvn0LD1_mx+rRg@mail.gmail.com |
| Views: | Raw Message | Whole Thread | Download mbox | Resend email |
| Lists: | pgsql-hackers pgsql-performance |
On Mon, Jan 14, 2013 at 12:23 PM, Tom Lane <tgl(at)sss(dot)pgh(dot)pa(dot)us> wrote:
> Robert Haas <robertmhaas(at)gmail(dot)com> writes:
>> I'm not sure I have anything intelligent to add to this conversation -
>> does that make me the wisest of all the Greeks? - but I do think it
>> worth mentioning that I have heard occasional reports within EDB of
>> the query planner refusing to use extremely large indexes no matter
>> how large a hammer was applied. I have never been able to obtain
>> enough details to understand the parameters of the problem, let alone
>> reproduce it, but I thought it might be worth mentioning anyway in
>> case it's both real and related to the case at hand. Basically I
>> guess that boils down to: it would be good to consider whether the
>> costing model is correct for an index of, say, 1TB.
>
> Well, see the cost curves at
> http://www.postgresql.org/message-id/13967.1357866454@sss.pgh.pa.us
>
> The old code definitely had an unreasonably large charge for indexes
> exceeding 1e8 or so tuples. This wouldn't matter that much for simple
> single-table lookup queries, but I could easily see it putting the
> kibosh on uses of an index on the inside of a nestloop.
The reported behavior was that the planner would prefer to
sequential-scan the table rather than use the index, even if
enable_seqscan=off. I'm not sure what the query looked like, but it
could have been something best implemented as a nested loop w/inner
index-scan.
--
Robert Haas
EnterpriseDB: http://www.enterprisedb.com
The Enterprise PostgreSQL Company
| From: | Tom Lane <tgl(at)sss(dot)pgh(dot)pa(dot)us> |
|---|---|
| To: | Robert Haas <robertmhaas(at)gmail(dot)com> |
| Cc: | Simon Riggs <simon(at)2ndquadrant(dot)com>, Jeff Janes <jeff(dot)janes(at)gmail(dot)com>, pgsql-hackers <pgsql-hackers(at)postgresql(dot)org> |
| Subject: | Re: [PERFORM] Slow query: bitmap scan troubles |
| Date: | 2013-01-14 17:56:37 |
| Message-ID: | 24605.1358186197@sss.pgh.pa.us |
| Views: | Raw Message | Whole Thread | Download mbox | Resend email |
| Lists: | pgsql-hackers pgsql-performance |
Robert Haas <robertmhaas(at)gmail(dot)com> writes:
> On Mon, Jan 14, 2013 at 12:23 PM, Tom Lane <tgl(at)sss(dot)pgh(dot)pa(dot)us> wrote:
>> The old code definitely had an unreasonably large charge for indexes
>> exceeding 1e8 or so tuples. This wouldn't matter that much for simple
>> single-table lookup queries, but I could easily see it putting the
>> kibosh on uses of an index on the inside of a nestloop.
> The reported behavior was that the planner would prefer to
> sequential-scan the table rather than use the index, even if
> enable_seqscan=off. I'm not sure what the query looked like, but it
> could have been something best implemented as a nested loop w/inner
> index-scan.
Remember also that "enable_seqscan=off" merely adds 1e10 to the
estimated cost of seqscans. For sufficiently large tables this is not
exactly a hard disable, just a thumb on the scales. But I don't know
what your definition of "extremely large indexes" is.
regards, tom lane
| From: | Bruce Momjian <bruce(at)momjian(dot)us> |
|---|---|
| To: | Tom Lane <tgl(at)sss(dot)pgh(dot)pa(dot)us> |
| Cc: | Robert Haas <robertmhaas(at)gmail(dot)com>, Simon Riggs <simon(at)2ndquadrant(dot)com>, Jeff Janes <jeff(dot)janes(at)gmail(dot)com>, pgsql-hackers <pgsql-hackers(at)postgresql(dot)org> |
| Subject: | Re: [PERFORM] Slow query: bitmap scan troubles |
| Date: | 2013-01-15 19:46:39 |
| Message-ID: | 20130115194639.GG27934@momjian.us |
| Views: | Raw Message | Whole Thread | Download mbox | Resend email |
| Lists: | pgsql-hackers pgsql-performance |
On Mon, Jan 14, 2013 at 12:56:37PM -0500, Tom Lane wrote:
> > The reported behavior was that the planner would prefer to
> > sequential-scan the table rather than use the index, even if
> > enable_seqscan=off. I'm not sure what the query looked like, but it
> > could have been something best implemented as a nested loop w/inner
> > index-scan.
>
> Remember also that "enable_seqscan=off" merely adds 1e10 to the
> estimated cost of seqscans. For sufficiently large tables this is not
> exactly a hard disable, just a thumb on the scales. But I don't know
> what your definition of "extremely large indexes" is.
Wow, do we need to bump up that value based on larger modern hardware?
--
Bruce Momjian <bruce(at)momjian(dot)us> http://momjian.us
EnterpriseDB http://enterprisedb.com
+ It's impossible for everything to be true. +
| From: | Tom Lane <tgl(at)sss(dot)pgh(dot)pa(dot)us> |
|---|---|
| To: | Bruce Momjian <bruce(at)momjian(dot)us> |
| Cc: | Robert Haas <robertmhaas(at)gmail(dot)com>, Simon Riggs <simon(at)2ndquadrant(dot)com>, Jeff Janes <jeff(dot)janes(at)gmail(dot)com>, pgsql-hackers <pgsql-hackers(at)postgresql(dot)org> |
| Subject: | Re: [PERFORM] Slow query: bitmap scan troubles |
| Date: | 2013-01-15 20:11:02 |
| Message-ID: | 1723.1358280662@sss.pgh.pa.us |
| Views: | Raw Message | Whole Thread | Download mbox | Resend email |
| Lists: | pgsql-hackers pgsql-performance |
Bruce Momjian <bruce(at)momjian(dot)us> writes:
> On Mon, Jan 14, 2013 at 12:56:37PM -0500, Tom Lane wrote:
>> Remember also that "enable_seqscan=off" merely adds 1e10 to the
>> estimated cost of seqscans. For sufficiently large tables this is not
>> exactly a hard disable, just a thumb on the scales. But I don't know
>> what your definition of "extremely large indexes" is.
> Wow, do we need to bump up that value based on larger modern hardware?
I'm disinclined to bump it up very much. If it's more than about 1e16,
ordinary cost contributions would disappear into float8 roundoff error,
causing the planner to be making choices that are utterly random except
for minimizing the number of seqscans. Even at 1e14 or so you'd be
losing a lot of finer-grain distinctions. What we want is for the
behavior to be "minimize the number of seqscans but plan normally
otherwise", so those other cost contributions are still important.
Anyway, at this point we're merely speculating about what's behind
Robert's report --- I'd want to see some concrete real-world examples
before changing anything.
regards, tom lane