Re: Enabling Checksums
| From: | Greg Smith <greg(at)2ndQuadrant(dot)com> |
|---|---|
| To: | Jeff Davis <pgsql(at)j-davis(dot)com> |
| Cc: | PostgreSQL-development <pgsql-hackers(at)postgresql(dot)org> |
| Subject: | Re: Enabling Checksums |
| Date: | 2013-03-07 04:17:12 |
| Message-ID: | 513814C8.9000204@2ndQuadrant.com |
| Views: | Raw Message | Whole Thread | Download mbox | Resend email |
| Thread: | |
| Lists: | pgsql-hackers |
TL;DR summary: on a system I thought was a fair middle of the road
server, pgbench tests are averaging about a 2% increase in WAL writes
and a 2% slowdown when I turn on checksums. There are a small number of
troublesome cases where that overhead rises to closer to 20%, an upper
limit that's shown up in a few tests aiming to stress this feature now.
On 3/4/13 10:09 PM, Jeff Davis wrote:
>> = Test 2 - worst-case overhead for calculating checksum while reading data =
>>
>> Jeff saw an 18% slowdown, I get 24 to 32%. This one bothers me because
>> the hit is going to happen during the very common situation where data
>> is shuffling a lot between a larger OS cache and shared_buffers taking a
>> relatively small fraction.
>
> I believe that test 1 and test 2 can be improved a little, if there is a
> need. Right now we copy the page and then calculate the checksum on the
> copy. If we instead calculate as we're copying, I believe it will make
> it significantly faster.
It's good to know there's at least some ideas for optimizing this one
further. I think the situation where someone has:
shared_buffers < database < total RAM
is fairly common for web applications. For people on Amazon EC2
instances for example, giving out the performance tuning advice of "get
a bigger instance until the database fits in RAM" works amazingly well.
If the hotspot of that data set fits in shared_buffers, those people
will still be in good shape even with checksums enabled. If the hot
working set is spread out more randomly, though, it's not impossible to
see how they could suffer regularly from this ~20% OS cache->shared
buffers movement penalty.
Regardless, Jeff's three cases are good synthetic exercises to see
worst-case behavior, but they are magnifying small differences. To see
a more general case, I ran through a series of pgbench tests in its
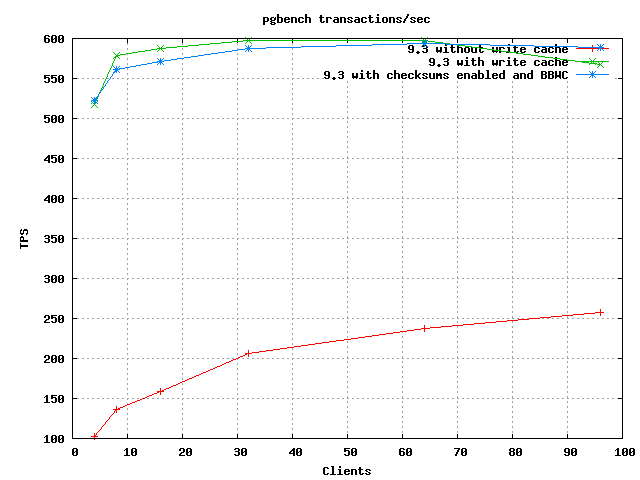
standard write mode. In order to be useful, I ended up using a system
with a battery-backed write cache, but with only a single drive
attached. I needed fsync to be fast to keep that from being the
bottleneck. But I wanted physical I/O to be slow. I ran three test
sets at various size/client loads: one without the BBWC (which I kept
here because it gives some useful scale to the graphs), one with the
baseline 9.3 code, and one with checksums enabled on the cluster. I did
only basic postgresql.conf tuning:
checkpoint_segments | 64
shared_buffers | 2GB
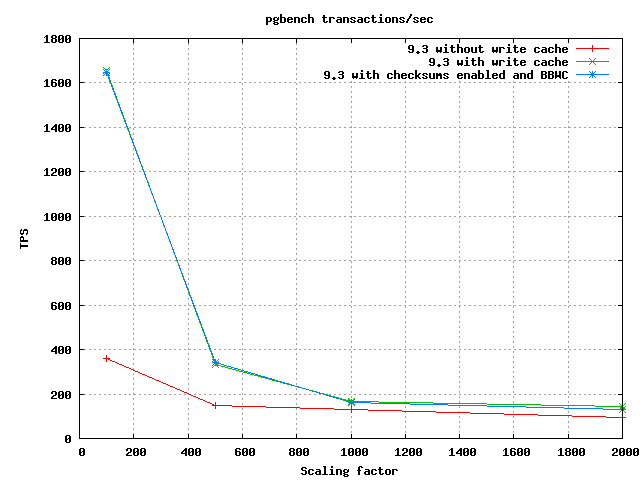
There's two graphs comparing sets attached, you can see that the
slowdown of checksums for this test is pretty minor. There is a clear
gap between the two plots, but it's not a very big one, especially if
you note how much difference a BBWC makes.
I put the numeric results into a spreadsheet, also attached. There's so
much noise in pgbench results that I found it hard to get a single
number for the difference; they bounce around about +/-5% here.
Averaging across everything gives a solid 2% drop when checksums are on
that looked detectable above the noise.
Things are worse on the bigger data sets. At the highest size I tested,
the drop was more like 7%. The two larger size / low client count
results I got were really bad, 25% and 16% drops. I think this is
closing in on the range of things: perhaps only 2% when most of your
data fits in shared_buffers, more like 10% if your database is bigger,
and in the worst case 20% is possible. I don't completely trust those
25/16% numbers though, I'm going to revisit that configuration.
The other thing I track now in pgbench-tools is how many bytes of WAL
are written. Since the total needs to be measured relative to work
accomplished, the derived number that looks useful there is "average
bytes of WAL per transaction". On smaller database this is around 6K,
while larger databases topped out for me at around 22K WAL
bytes/transaction. Remember that the pgbench transaction is several
statements. Updates touch different blocks in pgbench_accounts, index
blocks, and the small tables.
The WAL increase from checksumming is a bit more consistent than the TPS
rates. Many cases were 3 to 5%. There was one ugly case were it hit
30%, and I want to dig into where that came from more. On average,
again it was a 2% increase over the baseline.
Cases where you spew hint bit WAL data where before none were written
(Jeff's test #3) remain a far worst performer than any of these. Since
pgbench does a VACUUM before starting, none of those cases were
encountered here though.
--
Greg Smith 2ndQuadrant US greg(at)2ndQuadrant(dot)com Baltimore, MD
PostgreSQL Training, Services, and 24x7 Support www.2ndQuadrant.com
| Attachment | Content-Type | Size |
|---|---|---|
|
image/png | 5.3 KB |
|
image/png | 5.6 KB |
| Checksum-pgbench.xls | application/vnd.ms-excel | 21.5 KB |
In response to
- Re: Enabling Checksums at 2013-03-05 03:09:04 from Jeff Davis
Responses
- Re: Enabling Checksums at 2013-03-07 05:15:57 from Daniel Farina
Browse pgsql-hackers by date
| From | Date | Subject | |
|---|---|---|---|
| Next Message | Daniel Farina | 2013-03-07 05:15:57 | Re: Enabling Checksums |
| Previous Message | Greg Stark | 2013-03-07 04:12:27 | Re: Enabling Checksums |